Create a custom SAM report
You can combine any SolarWinds Platform Web Console widget or chart into a report. In this example, a custom report for IIS servers is created by modifying a predefined report, then adding a few more widgets for a complete picture of your IIS servers. To create this custom report, you will first need to create a custom property to identify nodes running IIS.
This report provides information about:
- IIS servers with disks approaching 100%
- Capacity for all disk volumes from the last seven days
- The percentage of disk space used for all disk volumes from the last seven days
- IIS instances with problems
- Availability of IIS Nodes
- Nodes with problems
Create a custom property to identify nodes running IIS
- In the SolarWinds Platform Web Console, click Settings > All Settings > Manage Custom Properties.
- Click Add Custom Properties.
- On the Select Object panel, select
Nodes, and click Next. - On the Choose Properties panel, in the Property Name field, enter
Type. - In the Format field, select
Text. -
Select Restrict values, and in the Value 1 field, enter IIS.
You can enter more values to identify other server types. This example uses just the IIS server type.

-
For Usage, select everything except Asset Inventory, and click Next.

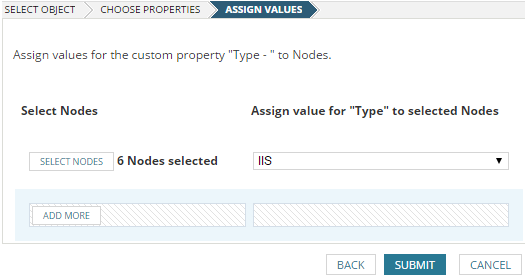
- On the Assign Values panel, click Select Nodes.
- Select the nodes to which you want to assign the property, and click Add.
-
In the list of Selected Nodes, click Select All, then click Select Nodes.

- Select IIS from the drop-down menu, and click Submit.

Create the IIS application server issue rollup report
-
Click Reports > All Reports > Manage Reports, and locate Disks Approaching 100% Capacity - This Month.

- Select the report, and click Duplicate & Edit.
- Enter the report name, for example, IIS Application Server Issue Rollup.
- For the widget in the first default row, click Edit Chart, rename the chart to IIS Servers with Disks Approaching 100% Capacity, and click Submit.
- In the From field, select Last 7 Days.
-
Click Edit.

-
Click the plus sign (+), and click Add Simple Condition.

- Click Select Field, and then locate and select Node > Nodes Custom Properties > Type.
-
Click Add Column.

-
Select IIS from the drop-down menu, ensuring the query reads
Type is equal to IIS.
- Add another simple condition, and locate and select Percent Used under Volume Current Statistics.
- Click Add Column.
-
Select the
is greater thanoperator and enter 70.The query should read:
Percent used is greater than 70. -
Click Add to Layout.

-
For the widget in the second default row, in the From field, select Last 7 Days.

- Click Add Content.
- In the Group By field, select Classic category.
- Select SAM Application Summary Report, and click Applications with Problems.
-
Click Select and Continue.

- On the Layout Builder panel, click Edit Resource, and in the Title field, enter
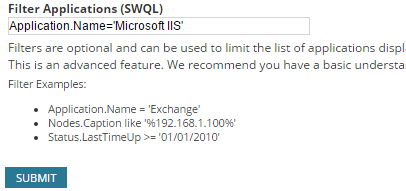
IIS Instance with Problems. - Add the following SWQL filter:
Application.Name='Microsoft IIS' - Click Submit.

- Click Add Content > Classic Category > Summary Reports > Availability of Each Node.
-
Click Select and Continue.

- Click Edit Resource, and in the Select a Time Period field, select Last 7 Days.
- In the Filter Nodes (SQL) field, enter:
type='IIS'. -
Click Submit.


When complete, your report should look similar to the following:

