How the API Poller feature in SAM works
If you're new to API requests, read this overview before adding your first API poller. You can also watch Intro to APIs for people who hate to program on THWACK and API Pollers: When SNMP Won't Cut It.
You can use the API Poller feature to monitor metrics via external REST APIs. Define your API endpoints, set up any required authentication, pick the metrics you want to monitor, and start monitoring. Send and received automated API requests to quickly exchange data with APIs offered by cloud services like Azure or any entity that make its data available via API, including SolarWinds.
SAM also includes predefined API poller templates that you can assign to nodes to monitor Azure, other SolarWinds products, and more. Check the SAM section under the Content Exchange area in THWACK for the latest templates, as posted by solarwinds_worldwide_llc and tagged with an API Poller label.
Review API documentation for requirements
After deciding which API you want to monitor, review the API documentation to learn about types of data provided, endpoints where data is stored, and what you need to include in API requests, such as tokens or specific headers.
Some cloud services limit the amount of free API requests per month and charge for extra requests. Check with your provider for details.
Add a managed external node
Use the Add Node wizard to add an external node where API pollers and received data can be stored.
Start creating the API poller
-
Click Settings > All Settings > Manage API Pollers.
-
When the Manage API Poller page appears:
-
Click New.
-
Click the row for the node where you're adding the API poller.
-
Click Create API Poller.

-
Add a Request URL
When the API Poller page appears:
-
Select a Method for the request. The default is GET, which retrieves data from an external API.
-
Enter a Request URL.

The URL specifies the location on the external API server where you want to access data, called an endpoint. For example, the SolarWinds Platform SDK endpoint is //##.###.##.###:17774/SolarWinds/InformationService/v3/, which includes these elements:
##.###.##.###: The IP address of your SolarWinds Platform server.17774: The HTTPS port for the SolarWinds Platform server./SolarWinds/InformationService/v3/: The path for the SolarWinds Information Service (SWIS) that provides API data for the SolarWinds Platform.
API URLs are similar to browser URLs that you use every day. For example, if you're an SolarWinds Platform Administrator logged in to the main SolarWinds Platform server, you can type https://localhost:17774/Orion/Login.aspx to access the SolarWinds Platform Web Console Login page. The URL indicates that you have a secure HTTP connection to reach a server over a specific port and that you're opening a specific form -- the Login page. API requests include much of the same information.
Configure API poller settings
Next, click Configure to add a name and description for the poller. In the API Poller settings dialog box, you can also:
-
Toggle SSL certification for the API host server on or off.
-
Enable SolarWinds Platform proxy server settings in the request.
-
Change the polling interval from the default value, 2 minutes.
-
Specify the type of authorization used by the API.
-
Add credentials.
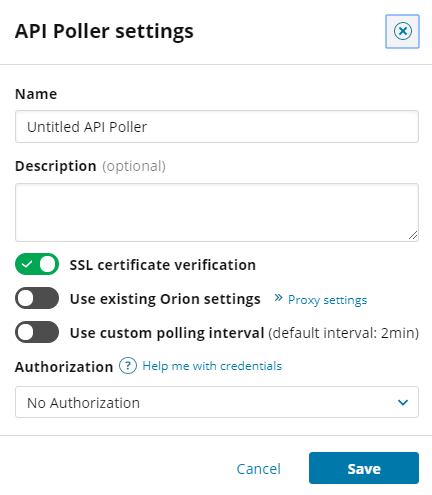
You can add, edit, or delete API poller credentials on the Manage Credentials page.
Click Save when finished.
Send an initial request
Click Send request and wait for a response from the external API.
The initial request sent from the SolarWinds Platform Web Console to the API does not consume a license. Only subsequent requests that collect metrics consume licenses. To poll API metrics, SAM uses the Main Polling Engine or an Additional Polling Engine, depending on the node configuration.
Data appears in the Response area of the page, which may include Expand (![]() ) icons you can click to display more data. A Monitor (
) icons you can click to display more data. A Monitor (![]() ) icon appears next to values that can be monitored.
) icon appears next to values that can be monitored.

A Response status code other than 200 indicates a failed request. Check the URL and settings to correct them, if necessary, and then try again. Review API documentation again for requirements. See also Troubleshoot API pollers in SAM.
You can monitor response headers, in addition to responses. For example, the SolarWinds Service Desk API includes the latest count of active tickets in response headers. Examine the SolarWinds Service Desk Incidents and Problems template to see how it leverages response headers.

You can also use macros and node-based custom properties in API requests.
Configure monitoring for the values retrieved from the API
Click the Monitor (![]() ) icon next to each value you want to monitor, and then define attributes for the value in the dialog box that appears, including how you want to store the value, if a numeric or string value is expected, and threshold levels. To learn more, see Configure monitored values in API pollers.
) icon next to each value you want to monitor, and then define attributes for the value in the dialog box that appears, including how you want to store the value, if a numeric or string value is expected, and threshold levels. To learn more, see Configure monitored values in API pollers.

When finished, click Save to close the dialog box and return to the API Poller page, where you can select more values to monitor, if necessary.
Save the API poller and wait for polling to finish
When you're finished setting up the API poller, click Save. After the next polling cycle is complete, monitored values appear in the API Pollers widget on the Node Details view.

Within the API Poller widget, you can:
-
Click the title of a metric to display only data for that specific metric in PerfStack.
-
Click an API poller name to display related metrics in PerfStack.

The status of a value appears as Unknown until the first successful poll occurs. It's also possible that the monitored value is not licensed (for example, if your SAM license expired or no SAM licenses are available).
For some real-world examples, see Work with API pollers.