Add dashboard widgets
- Log in to the SEM Console.
-
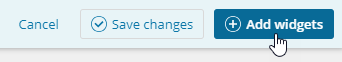
On the Dashboard toolbar, click Edit Dashboard.

- On the Edit Dashboard toolbar, click Add widgets.
The Creating Widget pane expands displaying a variety of widgets and widget templates.
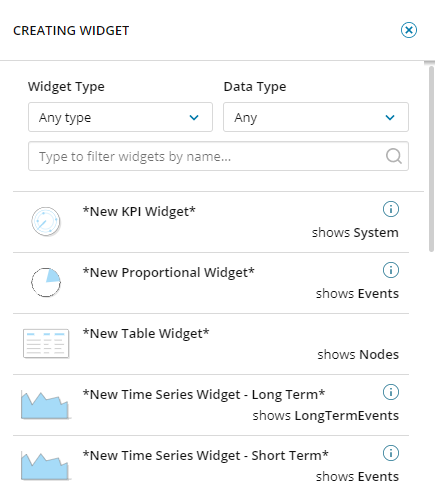
- Click the Widget type drop-down menu and select a widget category.
- Click the Data Type drop-down menu and select Any, Events, or Nodes.
- In the Search field, enter a term to refine your search.
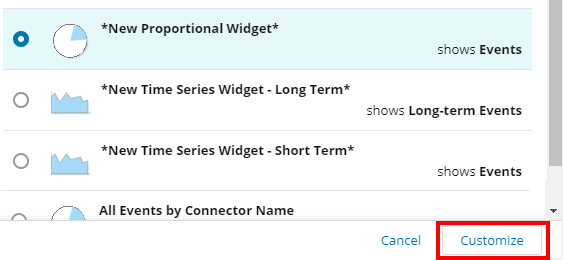
- Select a widget template (for example, New Proportional Widget), and then click Customize.
- Click the edit icon
 in each template section to name the widget, add widget features, and establish the graphic style and content derived from the designated data source. You can click Filter and Properties to set the values based on your existing Event table filters.
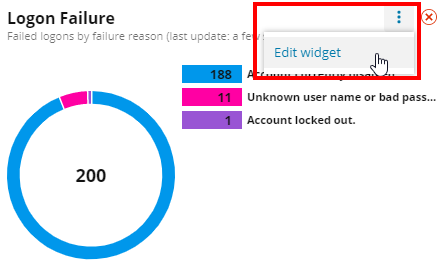
For example, to view the number of logon failures and the failure reason, set your filter to
Failed Logonsand your properties toFailureReason.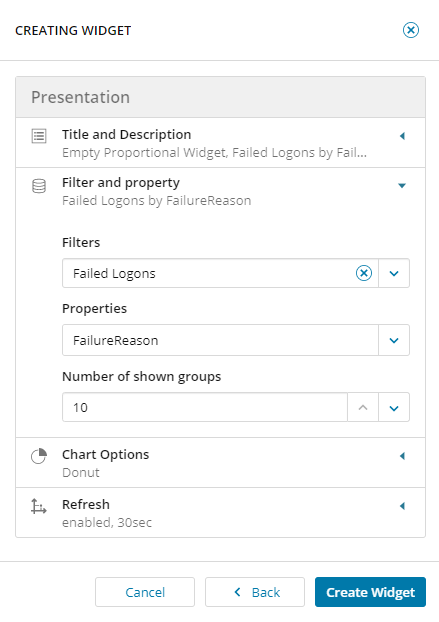
- The filter and properties are the primary values that populate widgets. You can create and customize numerous widgets to present key data points associated with your network environment. See the Filters pane in the Events tab to review specific event filters to use when customizing your widgets. See About SEM features for more information.
- The number of events that display in your widgets are established in your filter threshold settings.
- Click the arrows to set the number of groups to display in your widget.
- Select your chart type (Donut, Pie, Horizontal, or Vertical), legend, and refresh rate. As you make your changes, the widget preview updates to the left of the widget template.
The data refresh rate is set to 30 seconds by default. You can increase the refresh rate up to one hour or decrease it to one second.
- Click Create Widget, and then click Save changes.
The new widget displays on the SEM dashboard.
-
Move and resize the widget as needed.
To edit the widget (in edit mode), click the vertical ellipsis on the upper right of the widget and select Edit widget.
To leave edit mode, click Save changes on the Edit dashboard toolbar.
To view the associated widget records in the Events viewer, click the widget chart.