Monitor firewalls for unauthorized access
Configure SEM Manager to monitor your firewalls and detect unauthorized access such as port scans, unusual data packets, network attacks, and unusual traffic patterns.
To set up a firewall monitor, configure your firewalls to log to SEM, and then configure a new connector in the SEM Manager. When an unauthorized user attempts to access SEM, the event displays in the default Firewall filter running on the SEM console. You can also create custom filters that display network traffic to and from specific computers, as well as view web traffic and other traffic events across your network.
See Using the Threat Intelligence feed in SEM on the SolarWinds Success Center for more information.
Configure a firewall to log to SEM
You can configure SEM to collect firewall information from firewalls manufactured by Cisco, Check Point Software Technologies, Juniper Networks, and others. Set your firewall to log to your SEM appliance to centralize its log data with your SEM events.
See the SolarWinds Success Center or contact Technical Support for more information.
Configure a firewall connector on the SEM Manager
After you configure your firewall to log to SEM, configure the corresponding connector on your SolarWinds SEM Manager. Many of the firewall connectors are similar, and some will include unique settings.
The following example describes how to configure a Cisco PIX and IOS connector on your SEM Manager.
-
Log in to the SEM Console.
-
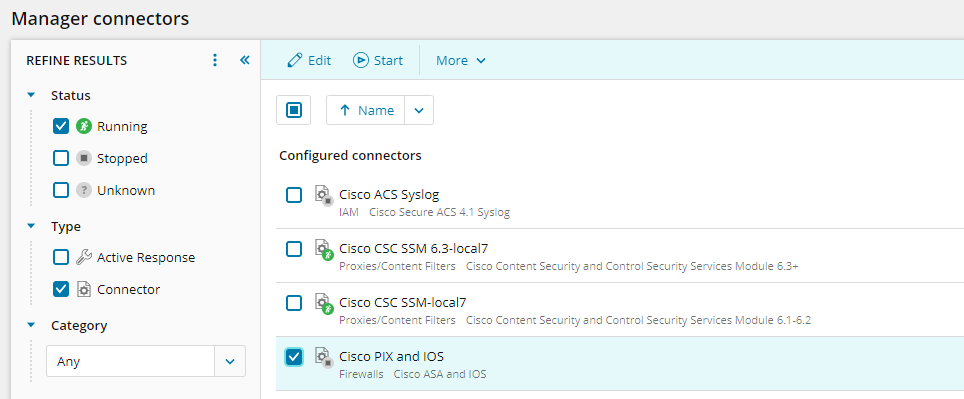
On the toolbar, click Configure > Manager connectors.
-
Locate the connector to configure.
Type part of the connector name (Cisco PIX) in the search box, or use the filter menus in the Refine Results pane.

- Select the connector, and then click Add Connector.
- Complete the connector configuration form. The following fields are common across most connectors:
- Name: Enter a user-friendly label for your connectors.
- Log File: Enter the location of the log file that the connector will normalize. This is a location on either the local computer (Agents), or the SEM appliance (non-Agent devices).
- Output: Normalized, Raw + Normalized, Raw. You only need to configure these values if SEM is configured to save raw (unnormalized) log messages.
- Click Add.
- Under Configured connectors, select your connector, and then click Start.

View network traffic from specific computers
You can create custom filters that highlight specific firewall events. For example, to monitor traffic from a specific computer, create a filter for all network traffic coming from the targeted computer. Use connector profiles and other groups to broaden or refine the scope of custom filters. The following procedure provides an example of creating a filter to monitor all traffic from a targeted computer.
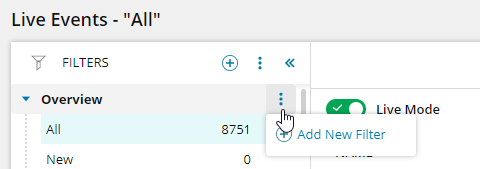
- On the SEM Console, click the Live Events tab.
- To create a filter at the group level in the Filters pane, move the mouse pointer over a group heading to expose the vertical ellipsis, and then select Add New Filter.

Or
To create a filter at the root level, click the add
 icon, and then select Add New Filter.
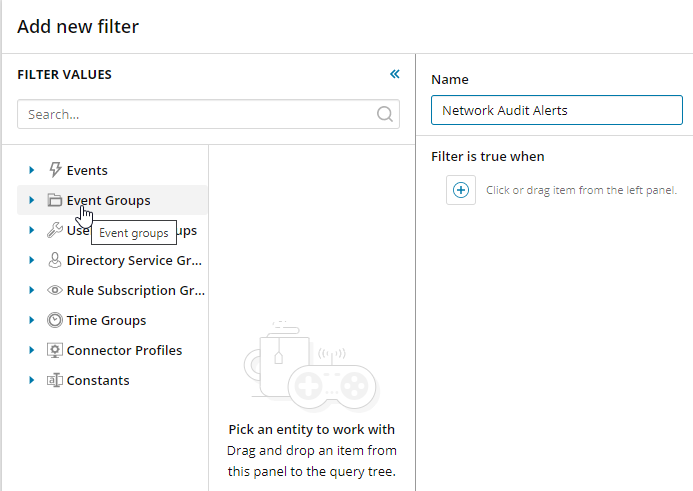
The Add new filter window is displayed.

- Enter a descriptive name for your new filter.
-
In the panel on the left, expand Event Groups, and then drag Network Audit Alerts into the filter builder.
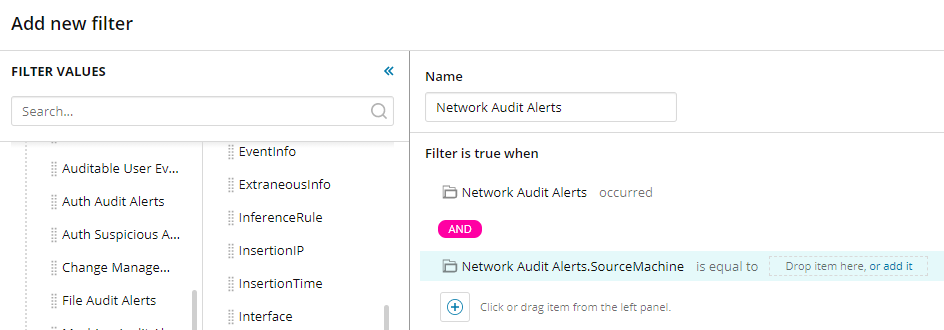
When you drag a value into the filter builder, the correct drop location is illuminated with a blue line.
- Under Network Audit Alerts, drag SourceMachine into the filter builder.

- Click Drop item here, or add it, enter the domain name of the computer, and click Save.
- Click Save to return to the Live Events screen.
- To view associated activity, click the Events tab, and then select your new filter. You can also set up a rule to alert on this activity by moving your mouse pointer over the filter, clicking the vertical ellipsis, and then selecting Send Filter to Rule. Learn more here.

