Monitor SEM from NPM and the Orion Web Console using SNMP
If you use Network Performance Monitor (NPM) and the SolarWinds Orion Web Console, you can use it to monitor CPU, memory, and other critical resources utilized by SEM. Complete the steps in this topic to configure SEM to communicate with NPM.
SEM can use SNMP version 3 to communicate with SolarWinds Network Performance Monitor (NPM).
Enable the SNMP Request Service
See Provide SNMP traps from SEM to other applications for details. After you enable and configure the SNMP Request Service, go to the next topic, Set up the Orion Web Console for SNMP monitoring.
Set up the Orion Web Console for SNMP monitoring
When you are finished enabling the SNMP Request Service, log in to the Orion Web Console and set up the SEM Manager as a monitored node on the Orion Platform.
- Log in to your Orion Web Console as an administrator.
-
Navigate to Settings > Manage Nodes, and then click Add a Node.
If the node already exists and it is not managed, click the node and select Not Managed Node > Yes to manage the node.
The Define Node dialog displays.
-
In the Polling Hostname or IP Address field, enter the IP address of the SEM Manager.
-
Under Polling Method, select Most Devices: SNMP and ICMP.

-
Select your polling method settings.

- From the SNMP drop-down list, select SNMPv3.
- Enter the port number used to access SNMP on the SEM appliance.
-
Under SNMPv3 Credentials, enter the user name used to access SNMP on the SEM appliance.
-
Under SNMPv3 Authentication, enter the hashing algorithm method and password.
-
Under SNMPv3 Privacy / Encryption, enter the communication encryption algorithm and password.
-
Accept the default selections in the remaining options.
-
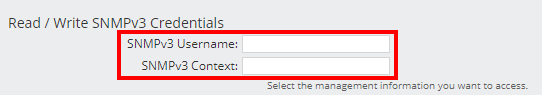
In the lower section of the form, ensure the fields remain blank.
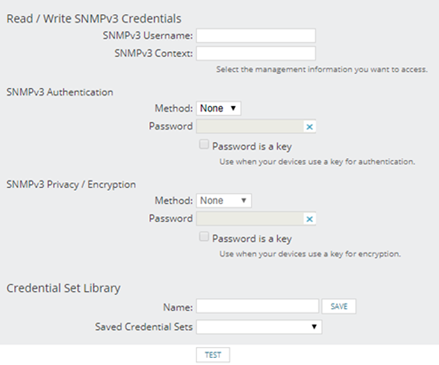
This is a SEM-specific setting for SNMPv3. Completing the Username and Context fields, for example, will cause the connection test to fail.
- To test the connection, click Test.
If the connection is good, Test Successful appears. If it fails, troubleshoot your Orion connection.
-
Click Next.
The Orion Platform authenticates the SEM Manager and runs a discovery to locate the resources available to monitor on the SEM appliance. The discovered resources will list all the elements that are available to monitor. The Orion Platform will automatically provide a list of selected resources based on the device type.
- In the Choose Resources dialog, select the resources to monitor on the node, and then click Next.
- In the Add Application Monitors dialog, click Next.
-
In the Change Properties dialog, click Next.
-
Click OK, Add Node.
The SEM appliance is added to the Orion Web Console for monitoring.
Troubleshooting your Orion connection
If you cannot establish a connection between your SEM appliance and the Orion Platform:
- Ensure that the settings you entered in the Define Node window match the settings used to enable the SNMP Request Service.
- Review the Orion logs located at
c:\ProgramData\SolarWinds\Discoveryfor errors. - Ensure the Username and Context fields in the lower half of the polling method configuration settings are empty.
See Unable to add nodes through the Web Console for additional troubleshooting information.