What if I am reporting metrics at irregular intervals?
When you report metrics at regular intervals, we can detect gaps if you set the Period in your Metric Attributes.
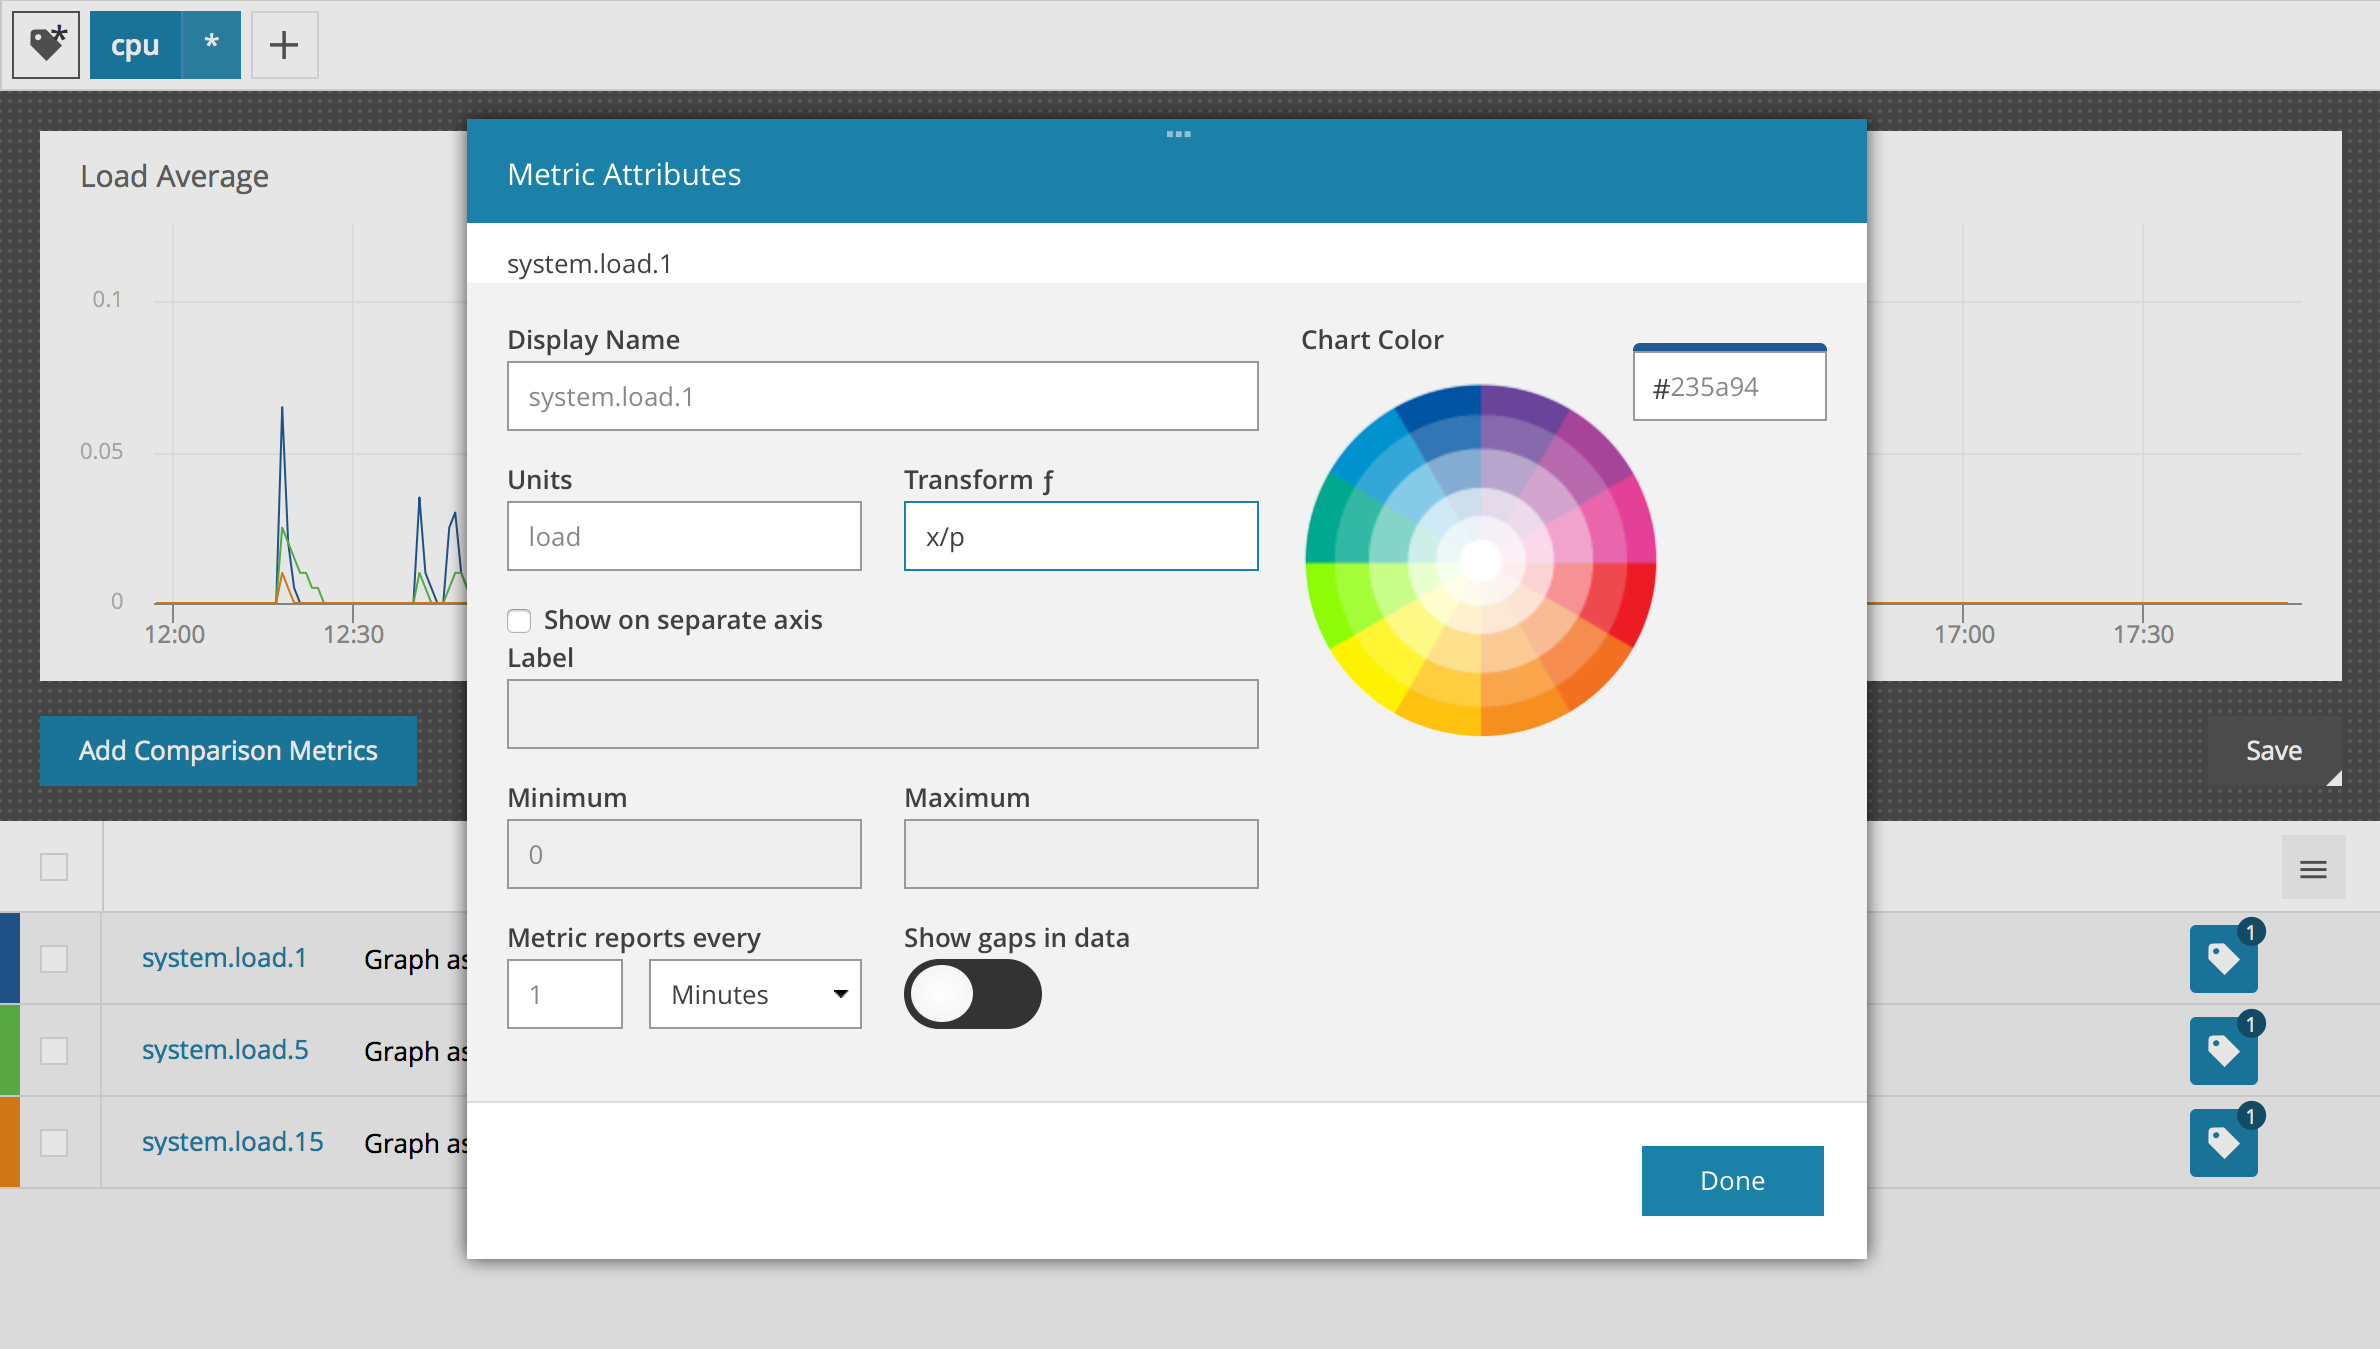
Some metrics are reported opportunistically. For example, every N seconds a measurement is sent only if there is new data. This results in a sparsely populated series. When the Period is set and Gap Detection is enabled, we render it as a set of invisible dots due to our gap detection. You can control the behavior in the stream attributes:
With Gap Detection and the aggregation method you have three ways to render your graphs:
- gap-detection enabled -> always render gaps
- gap-detection disabled -> connect points with straight lines
- (only for stacked graphs): gap-detection disabled, aggregate by sum -> zero-fill between points
Navigation Notice: When the APM Integrated Experience is enabled, AppOptics shares a common navigation and enhanced feature set with other integrated experience products. How you navigate AppOptics and access its features may vary from these instructions.