Databases & Queries
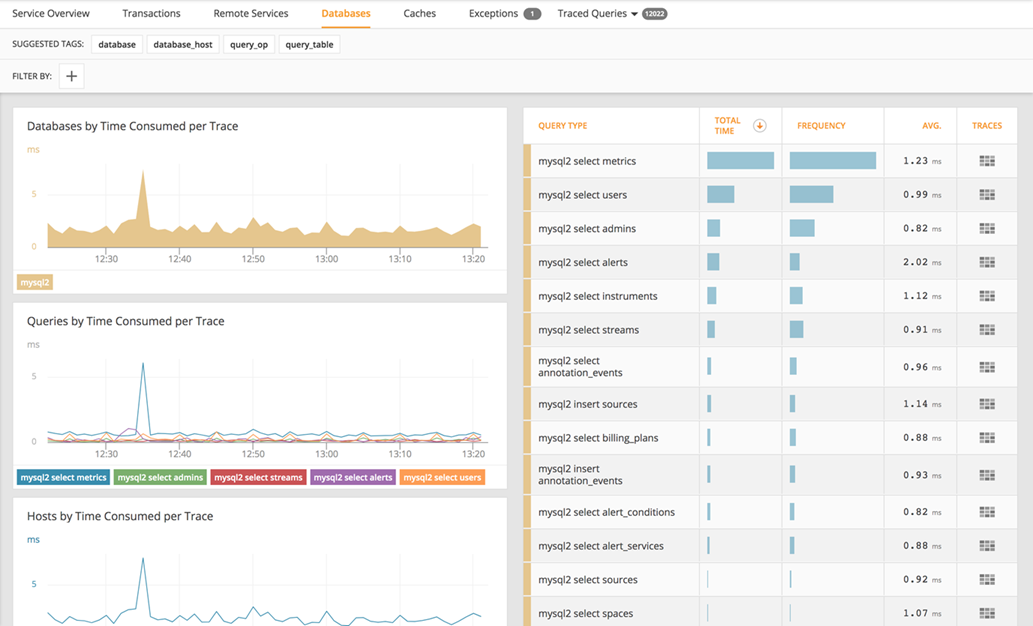
AppOptics automatically tracks database queries from the instrumented application. Databases provides you with the tools to analyze and troubleshoot frequent and long running SQL queries.
This overview includes analytics on the time consumed per trace at the host, database, and query level. The SQL query table allows you to quickly identify long running queries and inspect the individual traces which are invoked. By using the Filter By feature you can filter by any of the suggested tags to drill down into specific database hosts, databases, query operations, and query tables.

How databases and queries are classified
Four tags are gathered for queries, each of which can be used to group/filter the data:
- Database identifier -
database- The type of database being queried (for example:
mysql,mssql, …)
- The type of database being queried (for example:
- Database host -
database_host- The hostname or IP of the database
- Query operation -
query_op- The type of operation being performed (for example:
select) - For queries that involve multiple operations, only the first operation in the query text will be presented. However, the full text is available on drill-down to traces.
- The type of operation being performed (for example:
- Query table -
query_table- The table being queried, if relevant.
- For queries that span/join multiple tables, only the first table referenced in the query text will be presented. However, the full text is available on drill-down to traces.
Drilling down
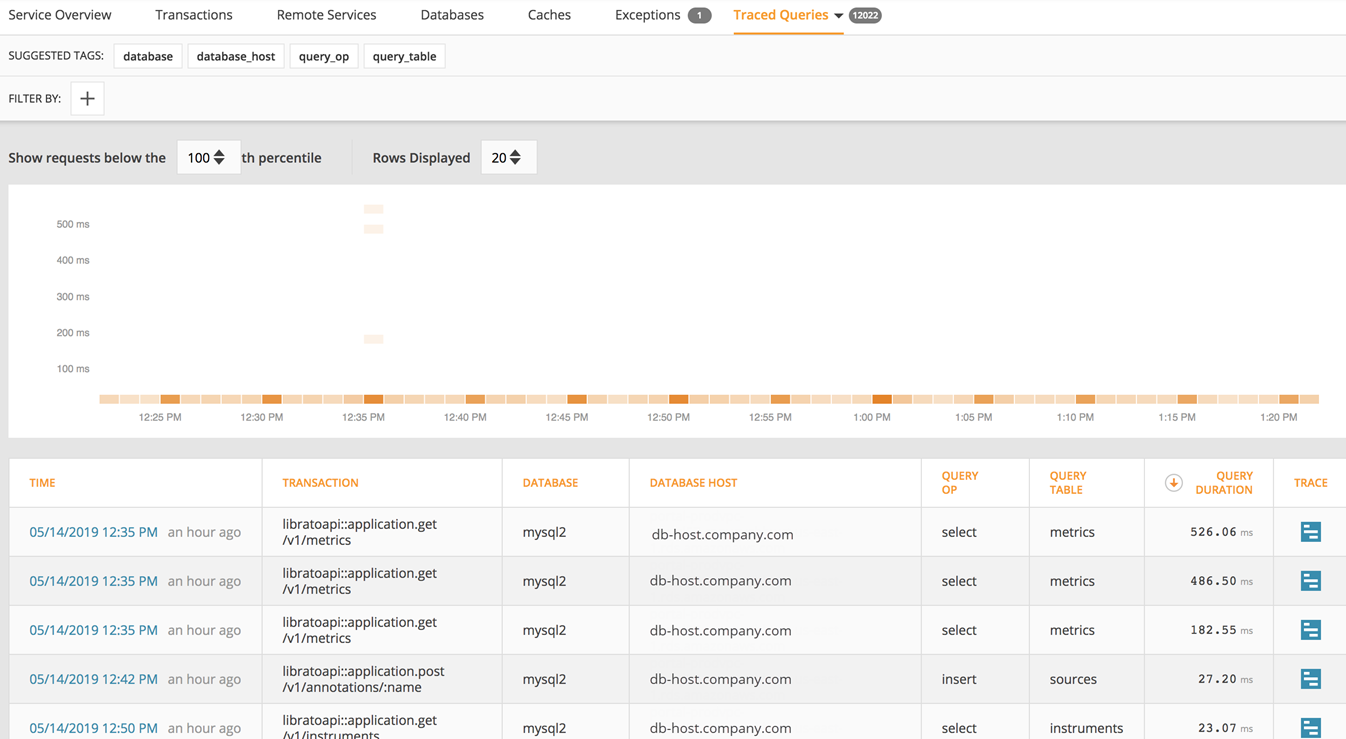
The data can be filtered using the controls at the top of the page, and you can also drill down to traces of requests that made a particular query by selecting Traced Queries in the drop down to the right.

The data in this view is gathered from sampled transaction traces, so it can all be mapped to example traces. Read more about sampling.
