Service Transactions
A transaction identifies a particular type of work within an application–for web applications, this typically means a particular controller/action or an individual endpoint for an API. When you install the APM agent on a supported framework, transactions will be automatically identified. For frameworks that are not supported, you can set up custom instrumentation.
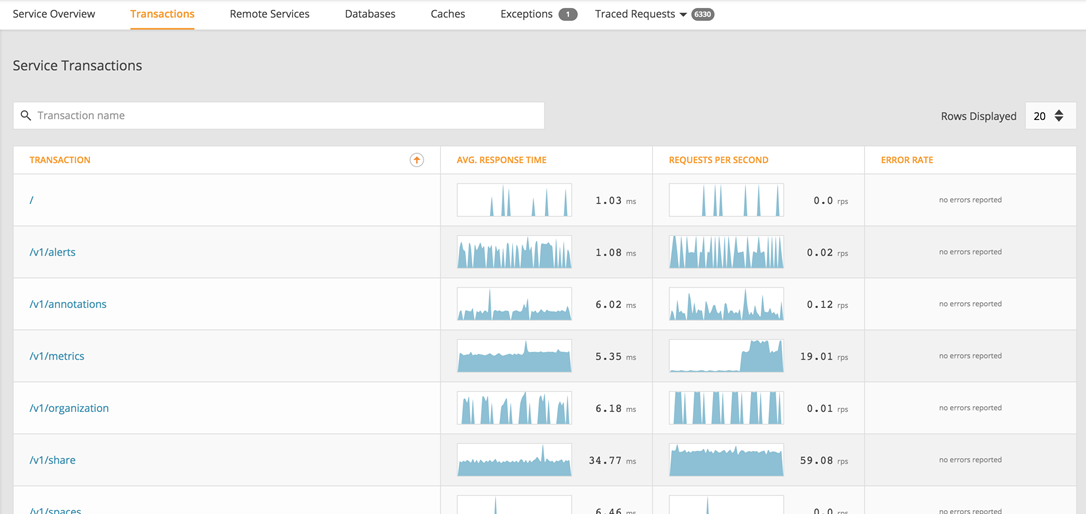
The Transactions page provides a view of each service monitored by the APM agent. Next to each service sparkline charts are provided, representing the average response time, requests per second, and error rate.

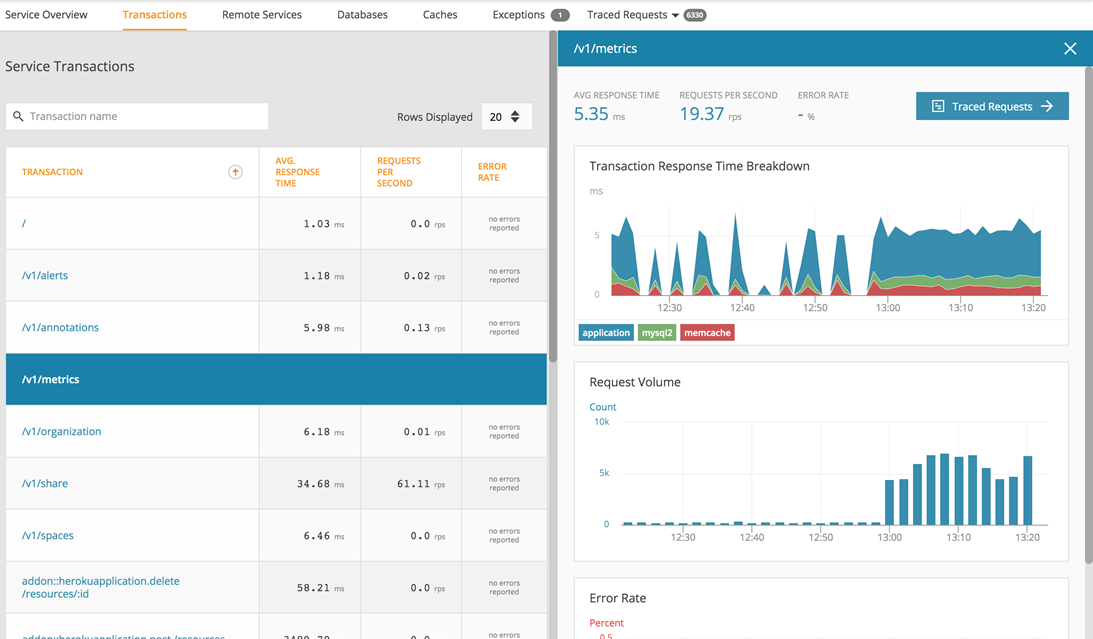
By selecting a transaction, you can access more detailed information about that transaction's performance including response time, request volume and error rate–as well as the ability to drill down to traces of requests involving that transaction.

Transaction Filtering
If you would like to exclude a certain transaction (for example a health-check /ping endpoint) from the monitored service, please see the transaction settings configuration option for the applicable agent:
