Code Profiling
The following content pertains to code profiling for the legacy AppOptics agents.
AppOptics agents are no long receiving updates. The new SolarWinds Observability libraries can send APM data in AppOptics and are regularly updated with new features and improvements. If you are still relying on the AppOptics agents and your components are supported by the new libraries, consider transitioning to the SolarWinds Observability libraries for your APM needs. Alternatively, you can use SolarWinds Observability as your primary APM solution.
If you have already transitioned to the new SolarWinds Observability libraries, see the SolarWinds Observability APM Services documentation for code profiling information.
SolarWinds Observability libraries are not compatible with AppOptics agents. Do not use a mix of SolarWinds Observability libraries and AppOptics agents to instrument applications that are part of a distributed trace.
Live code profiling provides a breakdown of the most frequent functions and methods in a transaction. The level of detail varies by language, but typically includes information down to the class, method, and even filename and line number. It provides enough detail to understand what line of code is causing a performance issue, and includes the information needed to quickly find the relevant section in the source code.
This works by automatically collecting statistical profiling data (which we call snapshots) associated with a transaction, where the agent takes stack traces at a set interval as the transaction is processed. On finish, the reported snapshots are analyzed to build a tree of call paths for the corresponding trace, which shows the frequency of occurrence of each frame in that path.
The interval at which the agent takes stack traces can be changed. The shorter the interval, the more accurate the call paths will be. However, a short interval also affects application performance and generates more data which increases bandwidth usage, so intervals shorter than the default 20ms (supported by some agents) should be used with caution.
Traces with duration shorter than the profiling interval might not have profiling information.
Enabling
Code profiling is disabled by default. See the links below to enable it in the supported agents:
- .NET (agent version 3.7.0 and up)
- Java (agent version 6.8.0 and up)
- PHP (agent version 3.4.0 and up)
- Ruby (
appoptics_apmgem version 4.13.0 or later)
Viewing
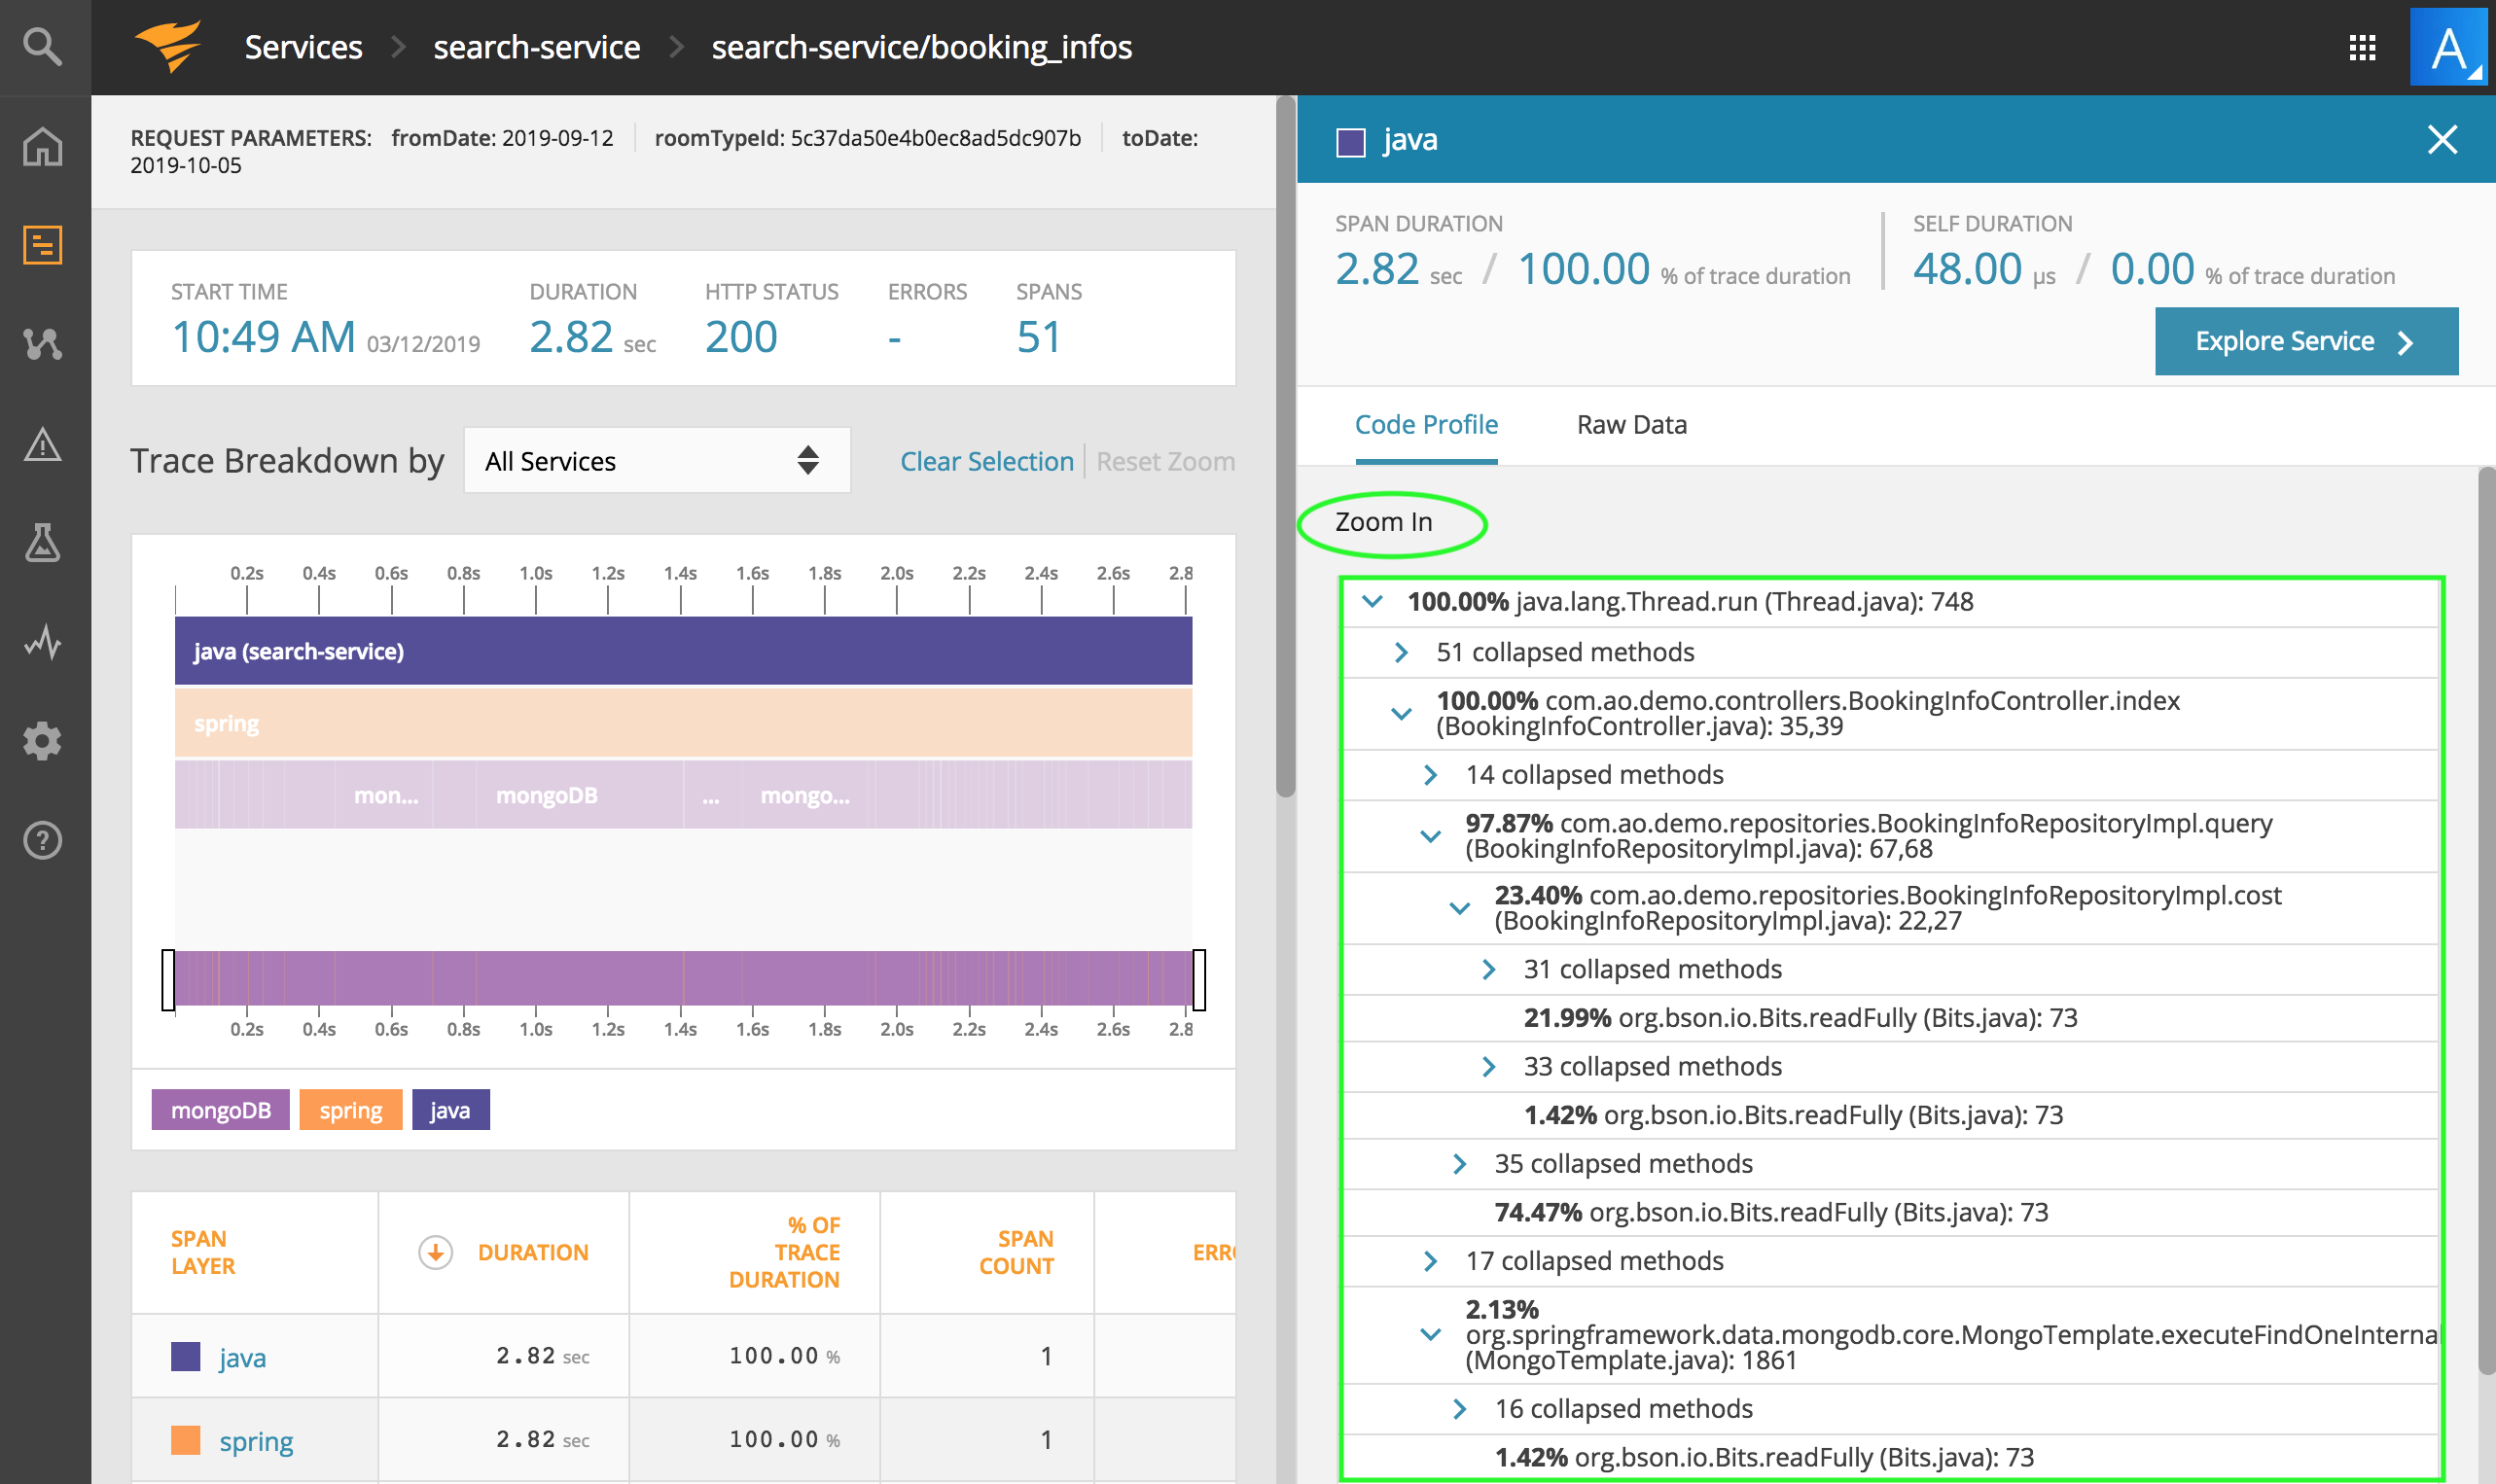
Once enabled, if a trace resulted in profiling information, you can see it by going to the Trace Details view, then clicking on a span (most likely you’d want to click the root span) to open the detail window on the right. If there is profiling information for the selected span, there will be a Code Profile tab that displays the tree of call paths and frequencies:

The tree is a parent-to-child view of the call paths built from stack traces reported in the profiling snapshots, where the tip or leaf node (the bottom path segment) of each branch is the frame in execution at the time the snapshot was taken. You'll find the following in each path segment:
Percentage – the frequency with which this frame occurred in the call path, as a percentage of all profiling snapshots collected for this trace. Thus the percentage will decrease as you traverse down a branch from the parent frame (which is found in all snapshots) to the frame in execution (found in a subset of the snapshots).
Function / File / Line Number(s) – each frame has one or more of these elements that identify the code in execution, please note there are language-specific variations in whether all pieces are available. The format is:
function or method name (file name): line numberWhen a function occurs in the same call path but on different line numbers, these are merged together for the percentage calculation and shown as a single path segment, with multiple comma-separated line numbers.
By default, the displayed tree collapses sequential path segments that have the same percentage, to better reveal possible bottlenecks in the code. You can use the "arrow" icon on the left of each segment to toggle this, and the Zoom In link above the tree to expand the Code Profile window.
In most cases the statistical profiling approach of taking snapshots on interval allows the agent to be performant while giving a good representation of the proportion of time being spent in different parts of the code. The trade-off is that short traces where only a few snapshots are collected will lose accuracy.
Language Specific Details
See the links below for agent-specific troubleshooting and factors that should be considered when using code profiling:
Navigation Notice: When the APM Integrated Experience is enabled, AppOptics shares a common navigation and enhanced feature set with other integrated experience products. How you navigate AppOptics and access its features may vary from these instructions.
The scripts are not supported under any SolarWinds support program or service. The scripts are provided AS IS without warranty of any kind. SolarWinds further disclaims all warranties including, without limitation, any implied warranties of merchantability or of fitness for a particular purpose. The risk arising out of the use or performance of the scripts and documentation stays with you. In no event shall SolarWinds or anyone else involved in the creation, production, or delivery of the scripts be liable for any damages whatsoever (including, without limitation, damages for loss of business profits, business interruption, loss of business information, or other pecuniary loss) arising out of the use of or inability to use the scripts or documentation.
