Understanding Metrics Roll-Ups, Retention and Graph Resolution
If you think your data looks odd or incorrect when you are viewing larger time frames such as the "last 24 hours", or "last 4 weeks", etc. but appears fine at the "last 30 minutes" and "last 60 minutes" resolutions, this might be due to the fact that we "roll up" your data.
If you are submitting a metric every 30 seconds and you look at it in the "Last 30 minutes" view you are looking at the "raw resolution", so up to 60 points in time. That same metric when viewing the last 60 minutes displays 120 points.
Roll-ups
For windows in time larger than 60 minutes we "roll up" the data in a given period of time using the methodology specified in the metric attributes (average, sum, min, max, or count). When viewing data at larger scales you are viewing this computed value.
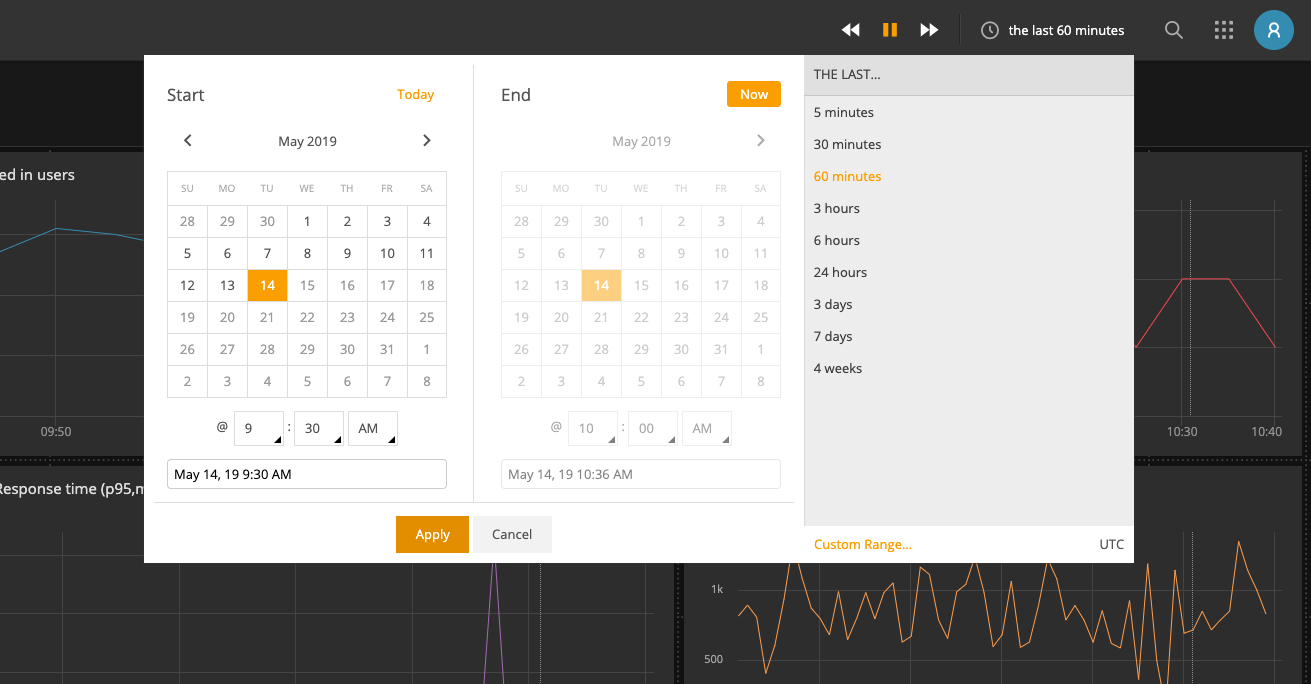
So for example, when you are viewing the 6 hour window, and you have set the metric attributes to aggregate using the average, the data points on the graph are not the measurements that you submitted but rather the average value of the measurements submitted in each 60 second period that is being graphed. The resolutions map to the date picker options as follows:
- Last 30 minutes: raw resolution
- Last 60 minutes: raw resolution
- Last 3 hours: 1 minute resolution
- Last 6 hours: 1 minute resolution
- Last 12 hours: 15 minute resolution
- Last 24 hours: 15 minute resolution
- Last 3 days: 1 hour resolution
- Last 7 days: 1 hour resolution
- Last 4 weeks: 1 hour resolution
Retention
The time frame / resolution settings available in the date picker menu were chosen to optimize the load time of graphs. We actually store your data at each resolution for much longer than the date picker options would suggest. Our retention schedule is as follows:
- 2 days at the raw resolution of the metric stream
- 32 days at 1 minute resolution
- 558 days (~18 months) at 1 hour resolution
How can you access your data at the higher resolutions? Use the date picker:
Custom Date Picker
The last option on the date picker menu is "Custom Range…" which allows you to pick any window in time to look at your data.

The date range picker allows you to specify a window in time down to the minute.
Two factors determine the resolution of the graph that is produced after selecting a custom date range:
1. The size of the window in time you select (From.. To…) 1. How far back in time you go
For example: Data at the raw resolution is only available within the last 48 hours. Let's say you pick a 60 minute window 10 hours ago, then the graph will show you raw resolution. If you pick a 90 minute window 10 hours ago it will show 1 minute resolution because the maximum window that can show raw resolution is 60 minutes.
You have to consider both the roll-up and retention schedules when you are trying to figure out what resolution the graph will be displayed at.
Another example: if you pick a 6 hour window 5 days ago, the graph will display with 1 minute resolution. If you pick a 6 hour window 3 weeks ago it will display at 15 minute resolution as we only store 1 minute resolution data for 8 days.
Not seeing the resolution you expected? We may be Downsampling
If you look closely, you may notice that a graph that you expected to display at one minute resolution is actually showing data points every 2 or 3 minutes. That would be due to downsampling. What does that mean? Sometimes there are more data points in a graph than pixels available on your screen. If that is the case we downsample so that the graph fits at the best resolution. You can then zoom in on a section in the graph by clicking and dragging directly in the graph - the zoomed in section will show at the 1 minute resolution you expected.
Why aren't my graphs showing the latest data?
When you are looking at resolutions that show rolled up data, you will notice that your latest data points aren't visible. For example if you are looking at the "Last 3 days" that give you 1 hour resolution, no data points will be shown that came in during the past hour as they haven't been rolled up yet. In the future we're going to backfill up until "now" by downsampling your native data but for now there will be a delay of at least one roll up period, maybe even slightly more.
AWS CloudWatch Users: AppOptics will poll your CloudWatch metrics every 5 minutes and then write the resulting data into your AppOptics account, including data that is at 1 minute intervals.
Navigation Notice: When the APM Integrated Experience is enabled, AppOptics shares a common navigation and enhanced feature set with other integrated experience products. How you navigate AppOptics and access its features may vary from these instructions.
