Trace Context in Logs
The following content pertains to trace context in logs for the legacy AppOptics agents.
AppOptics agents are no long receiving updates. The new SolarWinds Observability libraries can send APM data in AppOptics and are regularly updated with new features and improvements. If you are still relying on the AppOptics agents and your components are supported by the new libraries, consider transitioning to the SolarWinds Observability libraries for your APM needs. Alternatively, you can use SolarWinds Observability as your primary APM solution.
If you have already transitioned to the new SolarWinds Observability libraries, see the SolarWinds Observability APM Services documentation for trace context in logs information.
SolarWinds Observability libraries are not compatible with AppOptics agents. Do not use a mix of SolarWinds Observability libraries and AppOptics agents to instrument applications that are part of a distributed trace.
Application logs are often critical in troubleshooting, but in a busy system it can be hard to disentangle interleaved log messages to see those for a particular transaction. One approach is to assign each transaction a unique ID that is included in the log message; the challenge then becomes how to propagate this ID through concurrency mechanisms such as threaded or asynchronous processing and across distributed services.
Fortunately, this is exactly what our agents do. When a request enters an instrumented application, the agent creates a unique trace context (aka Trace ID) and maintains it through the lifetime of the transaction in order to report performance metrics, and if sampled, the transaction trace. And now it's possible to automatically add this Trace ID to your application logs.
Trace ID
The trace context inserted into application logs takes the form of a Trace ID that is 40 hex characters followed by a dash and one character denoting if the request is sampled (1) or not (0). Some examples:
5CAE5A1CB07D4273ED5197B4DB004D20AD7F698A-1– sampled (has a corresponding trace)BB7386517A8A9216FF160D69F1EBC5DC7CF7509C-0– not sampled (no corresponding trace)0000000000000000000000000000000000000000-0– no valid trace context, for example the current code flow is not traced
Agents will automatically insert the Trace ID with a tag or attribute name ao.traceId; please see the agent-specific pages
under Enabling for details on the inserted value under different configuration options and logging libraries.
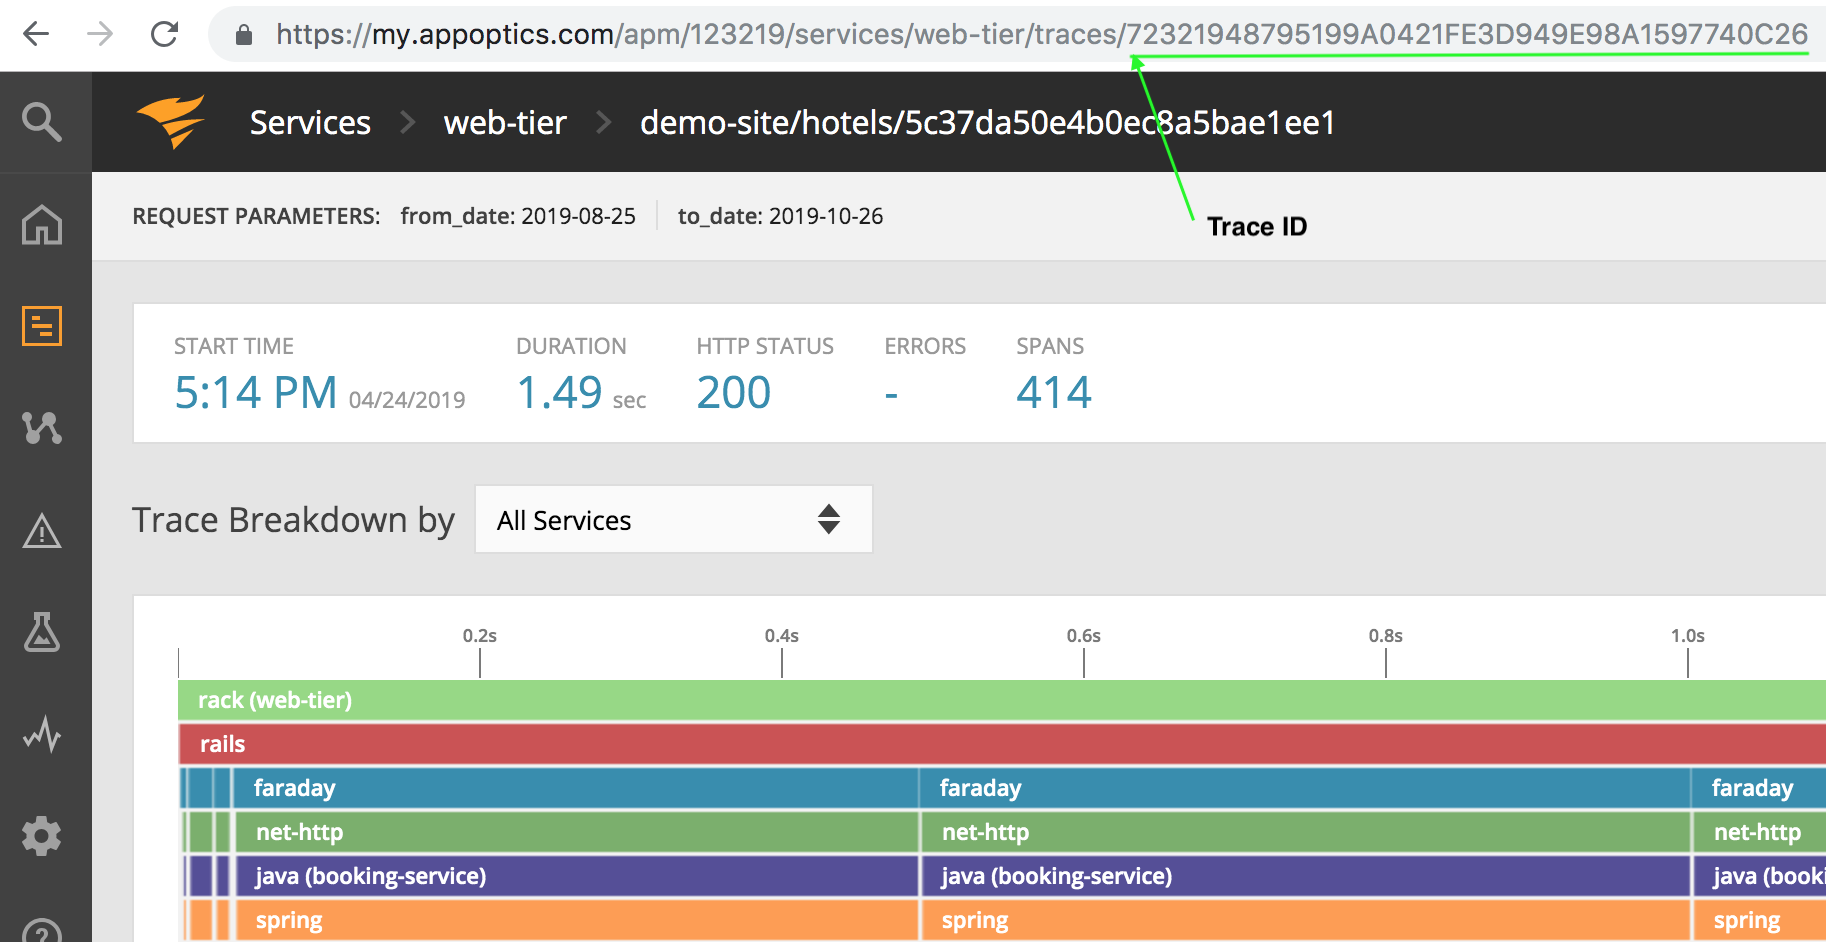
Transaction traces are also identified by this Trace ID in the Trace Details view. Have you ever noticed when pulling up a trace that the URL ends with a hex string?

With trace context in logs enabled, you can search application logs on this value (in the above example 72321948795199A0421FE3D949E98A1597740C26) to easily find log messages corresponding to the trace.
Conversely, if you see a Trace ID ending in -1 in the log message, there will be a corresponding trace that you can look
up in the dashboard – the easiest way is to copy the Trace ID excluding -1 from the log message, pull up any trace in the
Trace Details view and replace its Trace ID in the URL with the copied value, then reload the browser.
Enabling
Trace context in logs is disabled by default. See the links below on how to enable this feature in each agent, supported logging libraries and SDK examples:
- .NET (agent version 3.8.0 and up)
- Go (agent version 1.7.0 and up)
- Java (agent version 6.10.0 and up)
- Node.js (agent version 6.1.0 and up)
- PHP (agent version 3.6.0 and up)
- Python (agent version 4.1.0 and up)
- Ruby (agent version 4.7.0 and up)
Navigation Notice: When the APM Integrated Experience is enabled, AppOptics shares a common navigation and enhanced feature set with other integrated experience products. How you navigate AppOptics and access its features may vary from these instructions.
