Prepare to monitor autonomous systems in NTA
NTA collects and stores information regarding autonomous systems that network devices send in the NetFlow packets they export. You set up a network device for exporting autonomous system information as part of setting up the device to export NetFlow.
Since in sFlow BGP/AS information is provided in a special and extended header, NTA does not collect and process BGP/AS data for sFlow.
NTA collects NetFlow data, by default on port 2055, only if a network device is specifically configured to send to it. As a NetFlow collector, NTA can receive exported NetFlow version 5 data and NetFlow version 9 data that includes all fields of the NetFlow version 5 template. Once it collects NetFlow traffic data, NTA analyzes device bandwidth usage in terms of the source and destination endpoints of conversations reflected in the traffic.
All of these things need to be done for NTA to correctly monitor autonomous system networks through BGP:
- Each device must be configured as part of an autonomous system network, with specified connections to all neighbors within the system.
- Each device must be configured to export NetFlow data to NTA. For more information about required fields, see Autonomous system requirements for NTA.
- Each device must be configured to include one of the following statistics into the NetFlow exports:
origin-ascommand includes the origin AS for the source and destination.peer-ascommand includes the peer AS for the source and destination.You cannot include both origin and peer statistics.
- Each device that exports NetFlow data to NTA must be monitored in NPM.
Traffic from a device that is not monitored in NPM appears only in aggregate as part of the traffic from all unmonitored devices. If the device is setup to export data to NTA, but is unmonitored in NPM, the collector may receive the data without being able to analyze it meaningfully.
The specific interface through which a device exports NetFlow data must be monitored in NPM, and the interface index number for this interface in the SolarWinds Platform database (interface table) must match the index number in the collected flow data.
Set up a device for monitoring by NTA as part of an autonomous system
- Log in to the network device.
- Based on the documentation of the device, you would minimally do these things, adding the appropriate commands to the configuration file:
- Enable a BGP routing process, which places you in router configuration mode.
- Flag a network as local to this autonomous system and enter it to the BGP table. Enter as many networks as needed.
- Specify BGP neighbors. Enter as many neighbors as needed.
For example, for detailed information on BGP configuration for Cisco devices, see this Cisco documentation.
- Enable NetFlow export from your device.
- For detailed information on configuring NetFlow on Cisco devices, search for the appropriate configuration in the Cisco NetFlow Configuration guide (© 2021 Cisco, available at https://www.cisco.com/, obtained on May 6th, 2021).
- For information on enabling NetFlow for Cisco Catalyst switches, see Enable NetFlow and NetFlow data export on Cisco Catalyst switches.
- For information on enabling NetFlow on Cisco ASA devices, see Cisco ASA NetFlow overview.
- Otherwise, consult these examples as apply to your device:
- Brocade (Foundry) sFlow configuration
- HP sFlow configuration
- Extreme sFlow configuration
- Juniper sFlow configuration
- Juniper J-Flow configuration
- The documentation of your network device
-
Add the device exporting NetFlow to NPM for monitoring.
If you are adding a large number of NetFlow enabled nodes, use SolarWinds Platform Network Sonar. For more information, see Discovering and Adding Network Devices.
If you are only adding a few nodes, it may be easier to use Web Node Management in the SolarWinds Platform Web Console. For more information, see Adding Devices for Monitoring in the SolarWinds Platform Web Console .
-
Verify that the device is exporting NetFlow data as expected and that the device is monitored in NPM.
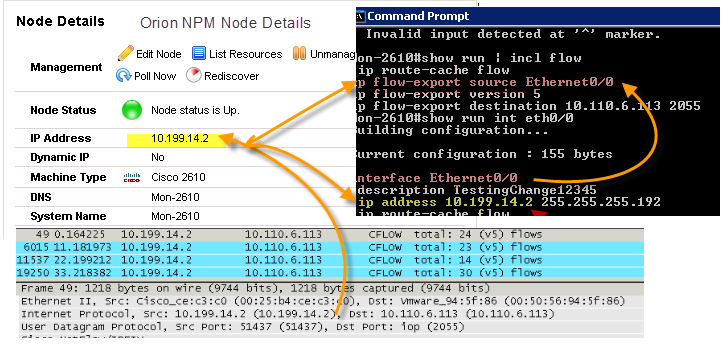
To verify that data are exported correctly, use a packet capture tool, such as WireShark, to search for packets sent from the network device to the SolarWinds Platform server.
Example
If you successfully add a NetFlow enabled device with IP address
10.199.14.2to NPM, and the device is actively exporting NetFlow data to the SolarWinds Platform server, you will see in WireShark a packet like the one (49) highlighted below in gray:
As expected, we see in the packet details that
10.199.14.2is its source IP address and10.110.6.113is the destination, which is the SolarWinds Platform server. This correlates with the node details on the device in the SolarWinds Platform, as highlighted in yellow.To verify that the IP address of the exporting interface on the network device is the one being monitored in SolarWinds Platform:
- Open a command line interface, log into the network device, and then type
show runto see the running configuration of the device. - Page down to the lines where the export source interface is defined. In this case, we see
ip flow-export source Ethernet0/0.
To discover the IP address for this interface, type
show run int Ethernet0/0. The IP address of the interface,10.199.14.2, is being monitored by the SolarWinds Platform server. - Open a command line interface, log into the network device, and then type
-
Click My Dashboards > NetFlow > NTA Summary.
Under NetFlow Source, verify the NetFlow-enabled nodes listed with a recent time posted for collected flow.
- Click My Dashboards > NetFlow > BGP. You should see chart statistics in the Top XX Autonomous Systems and Top XX Autonomous Systems Conversations widgets.
