Bandwidth capacity planning and analysis
Use SolarWinds NTA to monitor interface-level network bandwidth and traffic patterns over the course of months, days, or minutes. SolarWinds NTA converts flow data into charts and tables that quantify exactly how a network is being used, by whom, and for what purpose. This can help you to:
- Find the source of bandwidth use by application, protocol, and IP address group.
- Analyze traffic patterns over months, days, or minutes by drilling down into any network element.
- Specify whether network slowness caused by high bandwidth utilization is business related or private.
- Define whether or not you need additional bandwidth.
- Customize and deliver detailed network traffic and bandwidth reports.
Generate a WAN Interfaces Last 7 Days report
In SolarWinds NTA, flow data are stored in the NTA Flow Storage Database and CBQoS data are stored in the SolarWinds Platform database. Over time, both databases accumulate a large amount of information. SolarWinds offers a broad array of predefined reports, and the ability for you to create custom reports. For more information about reports, see the NPM Administrator Guide.
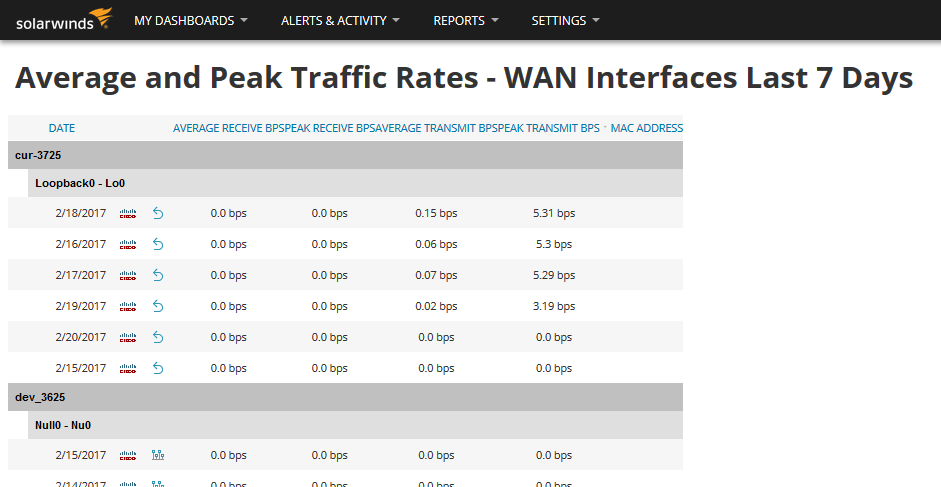
The report Average and Peak Traffic Rates - WAN Interfaces Last 7 Days displays the average and peak traffic rates for each WAN interface over the last week. Using this report helps you monitor bandwidth utilization and plan for future capacity needs.
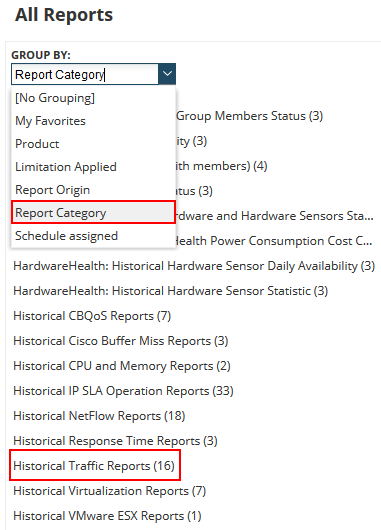
- Click Reports > All Reports.
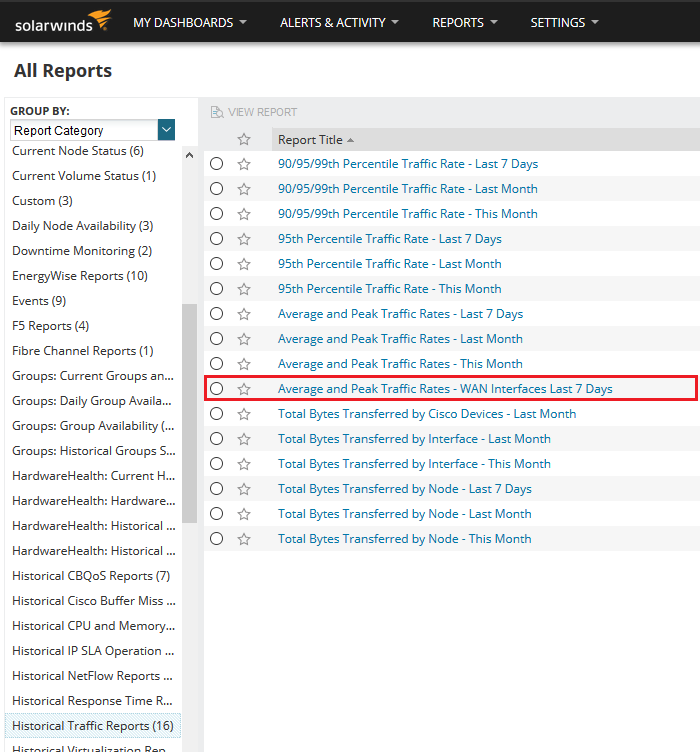
- Under Group By, select Report Category > Historical Traffic Reports.

- Select Average and Peak Traffic Rates - WAN Interfaces Last 7 Days to display the report.

The report provides the following values:
- Average receive bps.
- Peak receive bps.
- Average transmit bps.
- Peak transmit bps.
- MAC address.

