NetFlow-specific predefined alerts
Alerts must be enabled to trigger when the defined condition occurs. Not all out-of-the box alerts are enabled by default.
You need Alert Management Rights to enable, create, edit, delete alerts, or to view a list of available alerts.
Where can I manage NTA-specific alerts?
- Click Alerts & Activity > Alerts, and click Manage Alerts in the upper right.
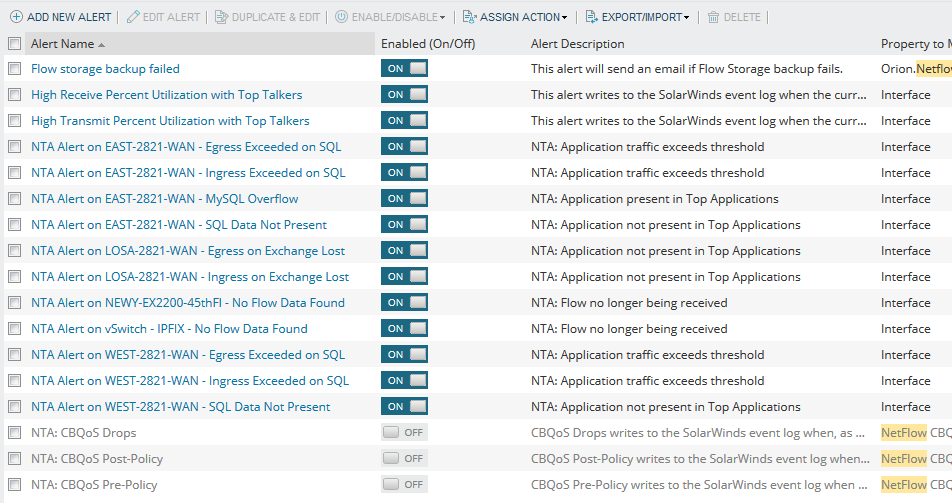
- In the Alert Manager, filter the alerts to display NTA-only items by typing
netfloworCBQoSinto the search box. - Make sure the alerts are on.

Flow alerts
You can create alerts on recently processed flows to quickly identify and solve quality issues. The Create a Flow Alert panel creates a standard SolarWinds Platform alert based on Custom SWQL query. If you want to change settings such as the Trigger Action, you must either do so in the Advanced Alert Editor, or delete the existing alert and create a new one using the Create a Flow Alert panel. The default values in the Create a Flow Alert panel are based on the standard Advanced Alert Editor functionality. See Configure Flow alerts for more information.
Application Threshold
This alert notifies you that a NetFlow-reporting node reports traffic for an application or NBAR2 application over or under a certain threshold. After you create an alert for the NBAR2 application and the threshold for a particular node, the alert is triggered when the traffic exceeds the threshold.
The alert can be created across multiple applications and NBAR2 applications. It is also possible to combine the applications and NBAR2 applications. This means that the alert will be triggered when the combined threshold of all selected applications is reached.
Application present in Top Applications / Application not present in Top Applications
This alert notifies you that an application or NBAR2 application is or is not present in Top XX Applications or NBAR2 Applications lists. After you create an alert for a specific application of NBAR2 application for a node or interface, the alert is triggered when the application or NBAR2 application is missing in the Top XX Applications or NBAR2 applications widgets.
Flow no longer being received
This alert notifies you that a device (node or interface) is not sending data over a defined time period.
Top talker alerts
High Receive Percent Utilization with Top Talkers
This alert indicates that the traffic received by the relevant interface exceeded the defined bandwidth usage threshold.
High Transmit Percent Utilization with Top Talkers
This alert indicates that the traffic transmitted by the relevant interface exceeded the defined bandwidth usage threshold.
By default, when triggered, top talker alerts do two things:
- When the percent utilization of an interface rises above the specified value, the alert writes the bandwidth utilization event to the SolarWinds event log. When the utilization drops back below a specified value, the alert writes another event to the log.
- Initiate a web capture of the most current top talker information and email the information to the configured recipient.
CBQoS alerts
The CBQoS alerts can help you confirm that the CBQoS policies applied to traffic flowing through your devices are producing the intended results. For example, the default Drops alert can notify you when packets dropped as a result of a policy exceed the 1GB threshold. Specify a policy and set up alert thresholds to get an early warning about traffic processing issues and intervene to better shape network traffic.
CBQoS out-of-the-box alerts are not enabled by default because you need to specify the policy and class path to complete the trigger definition.
Pre-Policy
CBQoS Pre-Policy writes to the SolarWinds event log when the amount of Pre-Policy traffic (in bytes) meets the conditions of your alert threshold setting.
Example of alert logged: CBQoS Pre-Policy traffic in class 'class-default (MCQTest)' with policy ‘policy-default (MPQTest)’ on interface 'FastEthernet0/0 link to core' met the conditions of your alert threshold setting. Total Pre-Policy traffic in the past 15 minutes: 99999 Bytes.
By default, this alert writes to the Event Log. This alert also can be configured to send the information in an email to the configured recipient.
Post-Policy
CBQoS Post-Policy writes to the SolarWinds event log when the amount of Post-Policy traffic (in bytes) meets the conditions of your alert threshold setting.
Example of alert logged: CBQoS Post-Policy traffic in class 'class-default (MCQTest)' with policy ‘policy-default (MPQTest)’ on interface 'FastEthernet0/0 · link to core' met the conditions of your alert threshold setting. Total Post-Policy traffic in the past 15 minutes: 99999 Bytes.
By default, this alert writes to the Event Log. This alert also can be configured to send the information in an email to the configured recipient.
Drops
CBQoS Drops writes to the SolarWinds event log when applying CBQoS policies to traffic on an interface.
Example of alert logged: CBQoS Drops met your alert threshold setting as a result of applying class map 'class-default (MCQTest)' and policy map ‘policy-default (MPQTest)’ on interface 'FastEthernet0/0 · link to core' . Total data dropped in last 15 minutes is: 00333 Bytes.
By default, this alert writes to the Event Log. This alert also can be configured to send the information in an email to the configured recipient.
Endpoint traffic alert
The Endpoint traffic alert in NTA is triggered when a single endpoint transfers more than 5 GB of data in last 60 minutes in any monitored segment of your network.
The endpoint must be monitored as an Agent, SNMP, WMI, ICMP, or External node. When you add the endpoints, the alert Endpoint traffic is over 5 GB in last hour can be enabled in the Alert Manager.
To add endpoints for monitoring to SolarWinds Platform, use:
-
Bulk addition of IP addresses using SWIS, SolarWinds Platform SDK, and SwisPowerShell module for PowerShell
For bulk addition using SWIS and SolarWinds Platform SDK you can use the below example PowerShell scripts, depending on if you want to monitor the status of the nodes or not.
To monitor the status of nodes using ICMP, use the following script:
# This sample script demonstrates how to add multiple Endpoints specified by
# IP Addresses as an ICMP nodes using CRUD operations.
#
# For ICMP nodes status is monitored by the SolarWinds Platform.
#
# Please update the hostname and enter credentials to match your configuration, and
# information about the endpoints you would like to add for monitoring.

Import-Module SwisPowerShell

# Connect to SWIS
$creds = Get-Credential
$swis = Connect-Swis -Hostname $hostname -Credential $creds

# Create a list of endpoint IPs

$endpoints = New-Object System.Collections.Generic.List[System.Object]

# Add Endpoint IPs as a list
$endpoints.AddRange(@("192.168.0.100", "192.168.0.144", "192.168.0.155"))

# Add two ranges of Endpoint IPs: 10.20.201.1 to 10.20.201.255, 10.20.202.1 to 10.20.202.255
for($i = 1; $i -le 255; $i++) { $endpoints.Add("10.20.201.$i") }
for($i = 1; $i -le 255; $i++) { $endpoints.Add("10.20.202.$i") }


# Add the endpoints as ICMP nodes

foreach ($endpoint in $endpoints)
{
    $exists = Get-SwisData -SwisConnection $swis -Query 'SELECT NodeID, Caption FROM Orion.Nodes WHERE IPAddress= @ip' @{ ip = $endpoint }

    if($exists)
    {
	Write-Host "$endpoint - Already exists"
    }
    else
    {
	$newNodeProps = @{
	    IPAddress = $endpoint;
	    Caption = $endpoint;
	    EngineID = 1;
	    ObjectSubType = "ICMP";
	    DNS = "";
	    SysName = "";
	    Community = "";
	    IsServer = 0;
	    SNMPV2Only = 0;
	}

	$newNodeUri = New-SwisObject $swis -EntityType "Orion.Nodes" -Properties $newNodeProps
	$nodeProps = Get-SwisObject $swis -Uri $newNodeUri

	# register specific pollers for the node
	$poller = @{
	    NetObject="N:"+$nodeProps["NodeID"];
	    NetObjectType="N";
	    NetObjectID=$nodeProps["NodeID"];
	}

	# Status
	$poller["PollerType"]="N.Status.ICMP.Native";
	$pollerUri = New-SwisObject $swis -EntityType "Orion.Pollers" -Properties $poller
	Write-Host "$endpoint - Created"
    }
}
To add the endpoints as external nodes without any monitoring, use the following script:
# This sample script demonstrates how to add multiple Endpoints specified by
# IP Addresses as an external nodes using CRUD operations.
#
# For External nodes no monitoring is provided by the SolarWinds Platform.
#
# Please update the hostname and enter credentials to match your configuration, and
# information about the endpoints you would like to add for monitoring.

Import-Module SwisPowerShell

# Connect to SWIS
$creds = Get-Credential
$swis = Connect-Swis -Hostname $hostname -Credential $creds

# Create a list of endpoint IPs

$endpoints = New-Object System.Collections.Generic.List[System.Object]

# Add Endpoint IPs as a list
$endpoints.AddRange(@("192.168.0.100", "192.168.0.144", "192.168.0.155"))

# Add two ranges of Endpoint IPs: 10.20.201.1 to 10.20.201.255, 10.20.202.1 to 10.20.202.255
for($i = 1; $i -le 255; $i++) { $endpoints.Add("10.20.201.$i") }
for($i = 1; $i -le 255; $i++) { $endpoints.Add("10.20.202.$i") }


# Add the endpoints as external nodes

foreach ($endpoint in $endpoints)
{
    $exists = Get-SwisData -SwisConnection $swis -Query 'SELECT NodeID, Caption FROM Orion.Nodes WHERE IPAddress= @ip' @{ ip = $endpoint }

    if($exists)
    {
	Write-Host "$endpoint - Already exists"
    }
    else
    {
	$newNodeProps = @{
	    IPAddress = $endpoint;
	    Caption = "vra-$endpoint";
	    EngineID = 1;
	    ObjectSubType = "ICMP";
	    DNS = "";
	    SysName = "";
	    Community = "";
	    External = 1;
	    IsServer = 0;
	    SNMPV2Only = 0;
	}

	$newNodeUri = New-SwisObject $swis -EntityType "Orion.Nodes" -Properties $newNodeProps
	Write-Host "$endpoint - Created"
    }
}
The scripts require SolarWinds Platform SDK and SwisPowerShell module for PowerShell. The scripts add endpoints specified by IP addresses as External or ICMP nodes. If the IP address is already monitored, the script does not add it as a duplicate node. You can modify the scripts to match your requirements, for example, by specifying the IP addresses as a list or as a range, or entering a valid hostname of your SolarWinds Platform Main Polling Engine server, username, and password.
To adjust the alert time range or the amount of data alerted on, create a copy of the Endpoint traffic alert and adjust the SWQL-based trigger condition:
-
To change the time range, adjust the condition
TimeStamp >= AddMinute(-61, DateTrunc('minute', GetUtcDate()).For 10 minutes, enter
11(10 + 1); for 120 minutes, enter121(120 + 1). -
To change the amount of data alerted on, adjust the condition
((SUM(Bytes)) / (1024 * 1024 * 1024)) > 5.For 20 GB, replace
5with20. The condition will then be((SUM(Bytes)) / (1024 * 1024 * 1024)) > 20; for 20 MB, enter((SUM(Bytes)) / (1024 * 1024)) > 20. -
To restrict specific endpoints, extend the
wherecondition by addingAND/ORparameters together with IP addresses of the endpoints you want to restrict.To restrict all endpoints with an IP address between 192.168.0.8 and 192.168.0.14 and specific endpoints 192.168.0.50 and 192.168.0.58, add
AND ((IP >= '192.168.0.8' AND IP <= '192.168.0.14') OR (IP IN ('192.168.0.50', '192.168.0.58'))).