VMware support in NTA
With NTA, you can view flow data from a VMware infrastructure.
Before you begin
- You must add vCenter to the SolarWinds Platform, choosing VMware/vCenter as the polling method.
- Make sure vCenter is added to the SolarWinds Platform in advance. After approximately 10 minutes, you can enable IPFIX export from the vCenter. This time is needed to correctly poll the data and identify hosts. If NTA receives any data beforehand, the data might be incorrectly handled and NTA will fire events about unknown traffic.
- SolarWinds recommends enabling the Automatic Addition of Flow Sources. All incoming flows will be automatically assigned and stored.
Discover a vCenter
- In the SolarWinds Platform Web Console, click Settings > All Settings.
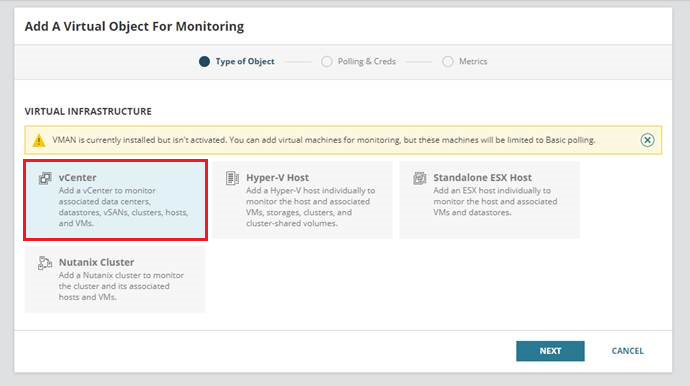
- Under Getting Started, click Add VMware, Hyper-V or Nutanix entities.
- On the Type of Object tab, select vCenter, and click Next.
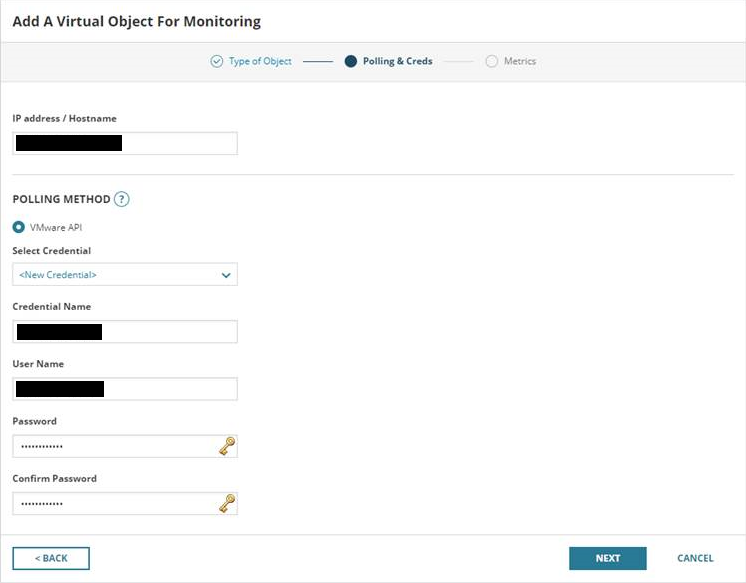
- On the Polling & Creds tab, enter the IP Address / Hostname, vCenter Credential name, vCenter User name, Password, and confirm the password.
For information on required permissions, see the VMAN documentation.
- Click Next.
- On the Metrics tab, review the metrics and click Finish or Finish and add another.
How to monitor flow from a distributed vSwitch
You can manage VMware devices only on the node level. On the Flow Sources Management page, select Node to see your VMware devices:
- In the SolarWinds Platform Web Console, click My Dashboards > NetFlow > Flow Sources.
You can also access the Flow Sources Management page by clicking Settings > All Settings > Under Product Specific Settings, click NTA Settings > Flow Sources Management.
- In the drop-down menu in the upper left of the page, click Node.
Your VMware devices will appear in the list. If you've assigned an IP address to your distributed vSwitch, you'll see all of your traffic sourced from one node - the address you assigned the switch. If you did not assign an IP address to the vSwitch, you'll see traffic sourced from your ESXi hosts.
Troubleshooting
I get unknown flow source events on an IP address associated with my VMware host.
This is normal behavior if you just added your VMware nodes. There is approximately a 10 to 20-minute interval before the devices are correctly polled, including IP address information.
Check that the node is managed and if you have disabled automatic addition of flow sources, add the node as a flow source manually.
I get unknown interface index events on VMware nodes.
This is normal behavior if you just added your VMware nodes. There is approximately a 10 to 20-minute interval before the devices are correctly polled.
I created virtual interfaces based on the event, but I don't see data for these interfaces.
This is normal behavior. You can delete the created interfaces so that they don't take up your NPM license limit.
I do not see flow data widgets on the details pages of my VMware devices.
Check that there are data visible for this device on the NTA pages and that they are correctly associated to the requested node.
Check that widgets are added to Node Details page (they are added by default, and hidden only if the node never received any flows).