Navigate NPM
 Watch this video: Navigating the Web Console
Transcript
After you have installed and configured NPM and specified the devices to monitor, you need to wait a few minutes for the SolarWinds Platform to collect data from the devices.
In the meantime, see the following terms that might be helpful when you explore NPM:
- SolarWinds Platform The common backend platform used by the SolarWinds Platform suite of products, including NPM, SAM, NCM, NTA, and more. The platform provides the backbone for navigation, settings, and common features like alerts and reports. It also provides a consistent look-and-feel across products, giving you a “single pane of glass” for your monitoring tools.
- SolarWinds Platform Web Console: The web interface you see when you log in to the SolarWinds Platform. It is used to view, configure, and manage all of your monitored objects. You can access the SolarWinds Platform Web Console from any computer connected to the Internet.
- View: An individual page in the web console.
- Widget: The informational blocks that make up a view.
- Entity: Anything that can be monitored by the SolarWinds Platform.
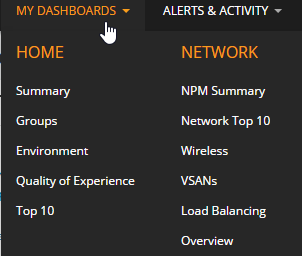
When you first log in, The Orion Summary Home view is displayed by default. The My Dashboards menu includes a submenu for each Orion module. If you have installed only NPM, this menu includes a Home submenu and a Network submenu.

Overview of an entity
Within a view, entities that appear in green are up and working as expected. Entities that appear red or partially red need attention. In this example, all nodes are up, but node Cur-Nor5520 has an issue as indicated by the red square next to the node name. The red square indicates that the system is monitoring a child of that node, for example, an interface.
See SolarWinds Platform status options for details on other colors.
To explore a node, place your cursor over the entity to see more details. In this example, one or more interfaces are down. Click the node to drill down to the node details page.
 Watch this video: Viewing Your Devices
Transcript

