Troubleshoot slow resources in a branch office
This topic provides an example of how you can troubleshoot an issue where employees in a branch office are complaining about slow resources.
Use Performance Analysis (PerfStack™) to correlate metrics, find out the cause of the issue, and resolve the issue.
This type of problem in this environment is often due to problems on the WAN interface. Use PerfStack to analyze the interface.
In this example, the Performance Analysis project includes the following metrics:
- Status to know whether the interface is up or whether the status is changing.
- Average Transmit bps to investigate the amount of traffic.
- Transmit Percent Utilization to investigate how close the interface is to being fully saturated.
- Transmit Discards and Percent Discards to investigate discarded data.
Start your analysis with the Branch Office WAN router (BOWAN).
- Click My Dashboards > Home > Performance Analysis.
- Locate the interface:
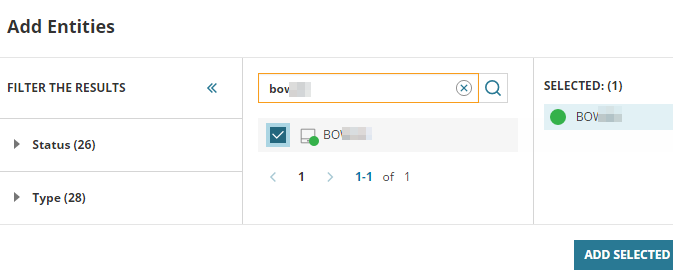
In the Metric Palette, click Add Entities.
Enter the router name into the entity filter, select the router, and click Add Selected Items.

Expand nodes, position the mouse over the router, and click the Add Related Entities button. Related entities, such as groups and interfaces, display in the Metric Palette.

- Add status information to the dashboard:
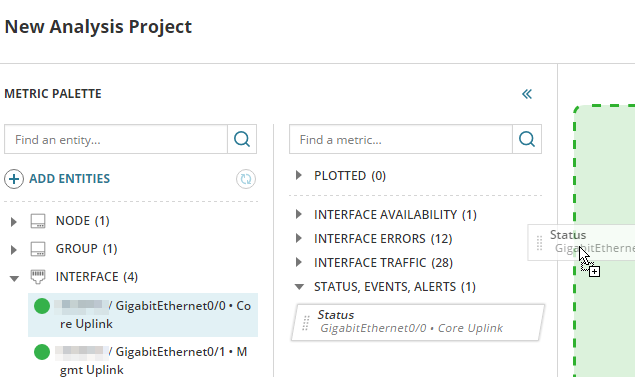
Select the Core Uplink interface in the Metric Palette.
Expand Status, Event, Alerts in Metrics and drag Status into the chart area.

- Investigate the utilization of the interface:
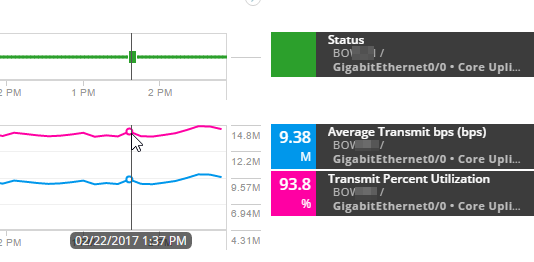
- Drag Average Transmit bps into a new chart. The traffic is not very high, it is around 9 Mbps.
To filter available metrics, type a part of the metric name into the field, for example
transmit. Drag Transmit Percent Utilization into the chart. The percent utilization is high, it is around 95%.
The two metrics indicate that 9 Mbps is approximately 95% of the interface utilization.

- Drag Average Transmit bps into a new chart. The traffic is not very high, it is around 9 Mbps.
-
To understand if high utilization is resulting in discarded frames, drag Transmit Discards and Percent Discards into a new chart. The interface discards 100% of the traffic. Discards can be caused by hardware or configuration issues.

- To verify the configuration and acting state on the port, log in to the device and check the configuration. For example, go to the BOWAN details view, and click telnet in the Node Details resource.
In this example, you discover that the interface is configured to run at 10 Mb. However, it is a Gigabit interface and it should be running at 1,000 Mbps. Correct the configuration to resolve the issue.
- To share the dashboard, simply share the URL. The URL contains all data to recreate the view.
- To keep the featured metrics in the dashboard for later use, click Save and enter a name for the Performance Analysis project. You can click Load to view the project again.
