View a network path
- Click My Dashboards > Network > NetPath Services. This view displays a list of created network services.
- Expand a service, and click one of the associated probes to see the network path from that probe to the expanded service.
Path layout
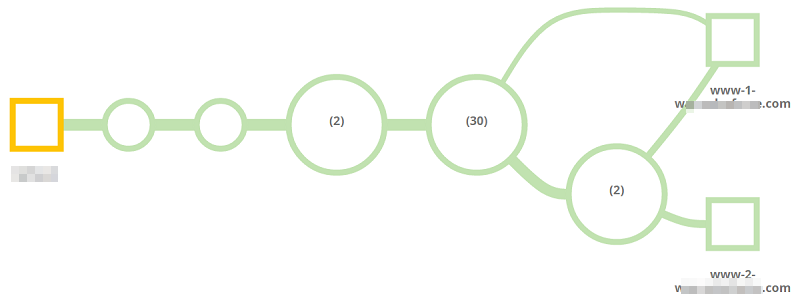
The source is on the left and the destination is on the right. The network path is everything in the middle.

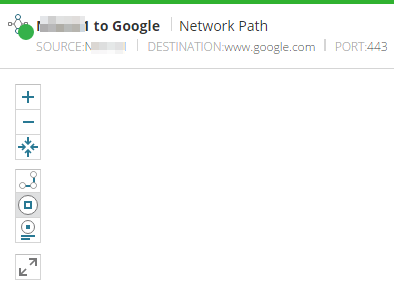
Use the controls in the upper left to change the zoom, detail levels of the path, and the amount of information displayed. You can also use your mouse to pan and zoom.

Objects in the network path include nodes, connections, and interfaces. Point to an object for a summary, and click it for details.
NetPath™ groups nodes into networks represented as larger circles. In the example below, the path goes through two (2) nodes in T-Mobile's network and 38 (38) nodes in Google’s network.

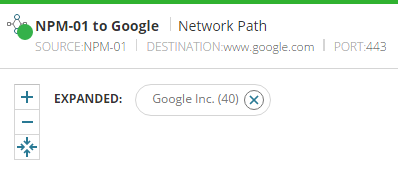
Click the network to show the nodes that comprise it, and click the X on the Expanded filter to collapse it.

The node information is cumulative from the source to that node. When you point to or click a node, the displayed metrics answer the question, “what is the performance between the source, along the path, up to this node?”

A connection between nodes shows latency and packet loss between its two nodes. When you point to or click a link, the displayed metrics answer the question, “what is the performance of this specific link?”

A dotted line illustrates a broken connection to a host that is unreachable. This means that traffic reached the green node, is destined for the endpoint connected with the dashed line, but does not make it.

Use the green, yellow, and red color coding to identify the nodes and connections that may be performing poorly and affecting the end-to-end connection. If you confirm that a service provider is responsible for the outage, you can contact them to resolve the issue.
Path history
The chart on the bottom shows metrics for the end-to-end performance. Select an interval to see the network path and its performance that resulted in that end-to-end performance.
Think of this as your network time machine. You can compare performance metrics from today or a previous time.

Available actions in the path history
- Click a bar in the chart to load the network path from that date and time.
- Click the single arrows, or press the Left and Right Arrow keys, to move one interval at a time.
- Click the double arrows to move to the beginning or the end of the displayed history window.
- Drag the bottom slider to change the history window.
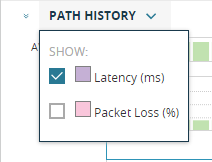
- Click Path History to show or hide Latency and Packet Loss in the chart.

