Define a custom statistic to monitor in the NPM
Statistics monitored on your devices are specified by pollers. Pollers hold information about a monitored property, how to get the current value for the property, and where and how to display the retrieved data.
Defining a custom statistic for monitoring means creating a UnDP poller.
Before you begin, consult your vendor documentation, and find out which OID you want to monitor.
- Start the Universal Device Poller application, for example by clicking Start > SolarWinds Orion > Universal Device Poller.
- If prompted, download and install the MIB database. See Update the SolarWinds MIB Database for SolarWinds Platform.
-
Specify the OID:
- Click Browse MIB Tree, and click Search MIBs in the upper-right corner.
- Select a Search By option, enter a string, and click Search.
- Select the OID, and click Select.
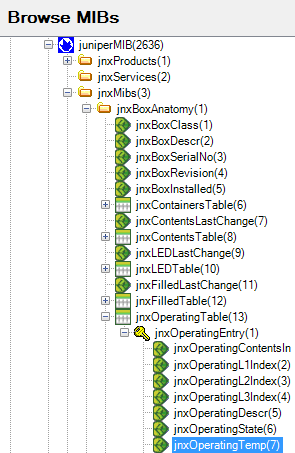
- If you know the OID, fill it in.
- If you know approximately where in the MIB tree you can find the OID, click Browse MIB Tree, navigate in the MIB tree to the OID, and click Select.
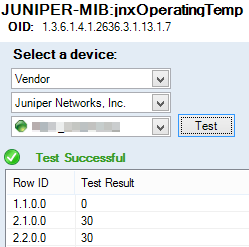
- Test the selected OID against a device. Select a node, and click Test. See Troubleshooting failed tests if the test fails.
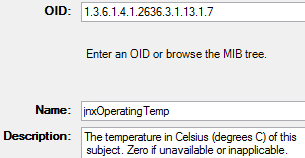
- On the Define Your UnDP screen, edit the suggested Name and Description. The poller name is populated automatically. The name is required and cannot contain spaces.
- To customize the value type, SNMP Get type, polling type or interval, click Advanced Options, and change the defaults:
- Select the expected format of values in MIB Value Type.
- For Rate or Counter, provide a Unit and Time Frame.
- For Raw Value, select a display Format for the polled raw values .
- For Raw Value > Enumerated, click Map Values to provide strings corresponding to the values returned by the poller.
- Select SNMP Get Type, and decide whether the poller should poll nodes or interfaces.
- Specify the Polling Interval in minutes. Use values between 1 and 600.
If you want to use the poller in a transformation, make sure that all pollers in the transformation have the same Polling Interval.
- Select the expected format of values in MIB Value Type.
- Keep default settings for Status (Enabled) and Keep Historical Data (Yes). With these options enabled, you can see the trend of polled values in SolarWinds Platform Web Console views.
- Specify the Group to which you want to add the poller, and click Next.
To create a new group, type a name for the group into the Group box.
- Select devices to poll the statistic, click Test, and then click Next.
Custom OIDs often work only for identical nodes.
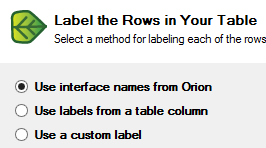
- If the selected OID is a table, specify labels for the rows in the table.
- Select the SolarWinds Platform Web Console views that can display the poller as a chart, gauge, or table, and click Finish.
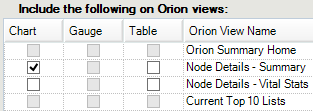
The new poller is added to All Defined Pollers and will be polled on the selected nodes or interfaces. You can now add Universal Device Poller resources showing the polled values to SolarWinds Platform Web Console views.
- To view the poller status on maps, create a network map, add the poller into the map, and add the map on a view. See View UnDP status on Network Atlas maps.
- To check that your UnDP pollers are properly configured, start Orion Diagnostics in your SolarWinds Orion > Documentation and Support program folder, right-click a UnDP, and select Run Tests.
Troubleshooting failed tests
If the test fails on a node or interface, make sure that the following settings are correct:
- Verify that the test node is being polled using the correct community string. See Edit node properties.
- Does the device support the polled MIB or OID? See the vendor documentation to confirm the MIBs supported by your device.
- Can your SolarWinds Platform server access the device? Make sure that the device is responding to both ICMP and SNMP requests.
