VeloCloud SD-WAN
You can monitor VeloCloud SD-WAN orchestrators, their edge devices, and interfaces via VeloCloud SD-WAN Orchestrator API (API-only monitoring).
For monitored VeloCloud SD-WAN nodes, you can see details about the orchestrator, edge nodes, and interfaces. You can use alerts and reports relevant for SD-WAN monitoring.
Monitor SD-WAN edge devices
Add edge devices managed by a monitored orchestrator to get further details via VeloCloud SD-WAN API.
- You can display general details, such as edge device name, model, serial number, status, or type.
- You can display all IP addresses for a specific VeloCloud SD-WAN device and properly match IPs received in NetFlow data to the node.
- You can monitor uplinks (WAN interfaces).
- You can monitor additional information for edge devices, such as status, response time, CPU/memory, polled via API
- You can monitor details about edge device interfaces, such as interfaces status or general details, polled via API
Monitor orchestrators
- You can display status and response time, polled via REST (VeloCloud SD-WAN Orchestrator API).
- You can display the list of all devices managed by an orchestrator and add these devices in a simplified discovery.
Monitor VPN tunnels
VPN tunnel names are created as follows:
{Source Interface Name} → {Peer Device Name}:{Peer Link Name}
VeloCloud SD-WAN setup and monitoring steps
Before you begin
-
Review the requirements for VeloCloud SD-WAN devices
-
Supported edge devices must have the following SNMP SysObjectID:
1.3.6.1.4.1.45346
How to poll VeloCloud SD-WAN devices - SNMP or API-only?
Available metrics depend on the polling method you select.
For VeloCloud devices, you can poll nodes via a combination of SNMP and API nodes or using only API.
-
SNMP nodes poll basic details via SNMP and SD-WAN data via API.
-
API-only nodes use API polling for both basic details and SD-WAN details.
SolarWinds recommends API-only polling when users cannot or do not want to poll device nodes via SNMP. API-only polling provides fewer details.
| Polled Details | API-Only | SNMP |
|---|---|---|
| Node details |
|
|
| Node status and response time |
|
|
| IP addresses |
|
|
| MAC addresses |
|
|
| Interfaces |
|
|
| Other general SNMP details |
|
|
| SD-WAN details |
|
|
| SD-WAN uplinks |
|
|
| SD-WAN tunnels |
|
|
| SD-WAN tunnel statistics |
|
|
| Topology |
|
|
Rate limits
A VeloCloud SD-WAN Orchestrator is limited to 500 requests every five seconds per each type of user (Operator, Partner, and Customer). SolarWinds Observability Self-Hosted doesn't send more requests than this limit but if other requests are sent for the same organization, the limit might be exceeded. For details, see VeloCloud SD-WAN API polling limit was exceeded.
Add SD-WAN devices for monitoring in SolarWinds Observability Self-Hosted
To monitor SD-WAN, add the VeloCloud SD-WAN orchestrator to the SolarWinds Platform database as a node, and then add edge devices.
Each monitored orchestrator uses a node license.
Add an orchestrator
-
Log in to the SolarWinds Platform Web Console as an administrator.
-
Click Settings > Manage Nodes, and then click Add a Node.
-
Provide the VeloCloud SD-WAN orchestrator hostname.
Enter a hostname. IP addresses are not supported at the moment.
-
In Polling Method, select Orchestrators: API.
-
Under Orchestrators, select VeloCloud Devices.
-
Select an authentication method:
-
For API Token, provide the API token.
-
For Username & Password, provide your credentials.
-
-
Review and adjust the device properties.
-
Review your credentials and proxy settings.
-
To edit how often the node status, or monitored statistics are updated, change the values in the Polling area.

For critical nodes, you may need to poll status information or collect statistics more frequently than the default polling intervals.
-
Enter values for custom properties for the node.
The Custom Properties area is empty if you have not defined any custom properties for monitored nodes. See "Add custom properties to nodes" in the SolarWinds Platform Administrator Guide.
-
To adjust when the status of the node changes to Warning or Critical, edit alerting thresholds for the metric. Select the Override box and set thresholds for the node.

-
-
Click OK, Add Node.
The device is now monitored as an SD-WAN orchestrator. Add connected devices to complete the SD-WAN configuration.
Add devices connected to the orchestrator
When you have added the orchestrator for monitoring, you need to add edge devices you want to monitor.
-
In SolarWinds Platform Web Console, click Settings > Manage Nodes.
-
On the Manage Nodes view, click the added orchestrator node.
-
On the SD-WAN Orchestrator Details view, click Discover VeloCloud Devices in the Management widget.
-
Select how to monitor edge devices:
-
Select Use a combination of SNMP and API polling to poll both SNMP data from the edge node and SD-WAN details from the orchestrator.
-
Select Use API polling only to poll SD-WAN data from the orchestrator.
See How to poll VeloCloud SD-WAN devices - SNMP or API-only?
-
- For SNMP and API polling, VeloCloud SD-WAN device hostnames and IP addresses are requested from the VeloCloud SD-WAN Orchestrator.
- For API-only polling, only the orchestrator endpoint is requested.
- If you selected API-only polling, review the selected orchestrator and click Next to continue to discovery settings and scheduling.
- If you selected the combination of SNMP and API, check the Network, SNMP, and Monitoring settings.
Review the hostnames and IP addresses received from the orchestrator. Include only the devices you want to monitor and click Next.
On SNMP, make sure SNMP credentials for the devices are listed and click Next. If appropriate credentials are not listed, click Add New Credential, and define a new set.
-
Complete the wizard by clicking Discover on the last tab. The wizard searches your network for the hostnames/IP addresses.
-
Discovered devices are listed in the Network Sonar Results wizard. Complete the wizard to add the devices for monitoring.
How do I add SD-WAN edge devices for monitoring?
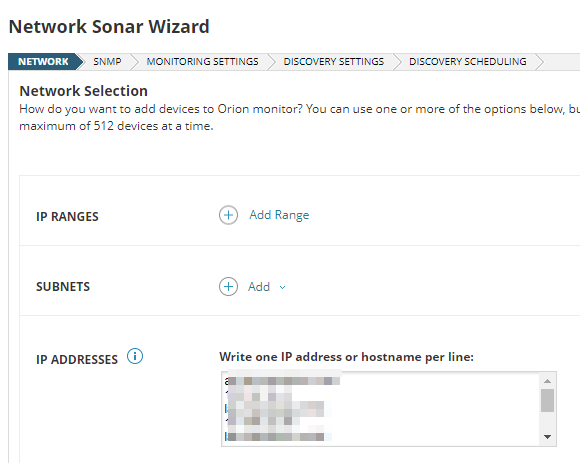
When you click the Discover VeloCloud Devices button on the SD-WAN Orchestrator Details page, SolarWinds Observability Self-Hosted requests the following details from the orchestrator:
A simplified version of Network Sonar Wizard opens and the details from the orchestrator are automatically listed in the IP Addresses box.
When you finish the wizard, go to the SD-WAN Orchestrator Details page (Settings > Manage Nodes > click the orchestrator node). After the next poll, the page will display data not only for the orchestrator, but also for monitored edge devices.
Configure SD-WAN monitoring on edge devices already monitored with SolarWinds Platform
If you monitored SD-WAN edge devices in a previous version using SNMP and upgraded to SolarWinds Observability Self-Hosted, add the VeloCloud orchestrator to automatically pair them with the orchestrator.
Monitor SD-WAN data in your environment
When you enable SD-WAN polling for an orchestrator node and click it, the SD-WAN Orchestrator Summary page opens.
By default, it includes widgets you can use to manage the device, view the device details, active alerts, latest events, or AppStack for the device.
Edge Devices
This widget lists device names, IP addresses, models, serial numbers and network IDs of edge devices paired with the orchestrator.
List of VLANs on Node
This widget is available on edge Node Details view, in the Network tab. It lists Virtual Local Area Networks (VLANs) on the node.
Orchestrator Inventory
This widget displays a list of devices connected to managed orchestrators. Devices managed by SolarWinds Observability Self-Hosted are marked in the Managed by Platform column.
To add unmanaged devices, click the Discover VeloCloud Devices button and add them for monitoring.
SD-WAN Map
This widget is available on Orchestrator views. It displays connections between monitored devices on the network. For directly connected devices, you can also see used interfaces.
Top Tunnels
On SD-WAN Orchestrator views, the widget displays the metric data (jitter, latency, or packet loss) for top VPN tunnels based on the metric. The widget shows top tunnels on all edges monitored by the orchestrator.
On an edge Node Details view, the widget displays the metric data (jitter, latency, or packet loss) for VPN tunnels on the node.
By default, the widgets display a maximum of 10 tunnels. To change the number of tunnels displayed, complete the following steps:
- Using an account with administrative privileges, click Settings > All Settings and then click Web Console Settings.
- In Classic Chart Settings, provide the appropriate number of tunnels to be displayed as the value for Maximum number of data series displayed on chart and submit your changes.
VPN Connections
On SD-WAN Orchestrator views, this widget displays VPN tunnels for all edges paired with the orchestrator.
On an edge Node Details view, the widget displays VPN tunnels for the edge.
This widget is not displayed by default. See Add widgets to SolarWinds Platform views.
VPN Tunnels
On SD-WAN Orchestrator views, this widget displays VPN tunnels and their metrics for all edges paired with the orchestrator.
On an edge Node Details view, the widget displays VPN tunnels and their metrics for the edge.
To see VPN tunnel details for VeloCloud orchestrators, you need to have polling for VPN tunnels enabled. By default, the option is enabled.
Verify that polling for VPN tunnels is enabled
- Click Settings > All Settings, and then click Polling Settings.
- Scroll down to VeloCloud settings, enable the Poll VPN Tunnels box, and submit the changes.
Warm Spare
On SD-WAN Orchestrator views, this widget displays High Availability information on all edges paired with the orchestrator.
On an edge Node Details view, the widget displays High Availability information.
High Availability (HA) details displayed in the widget include the device name, status, serial number, HA role, HA mode, and peer device name.
WAN UpLinks
On SD-WAN Orchestrator views, this widget displays WAN uplinks for all edges paired with the orchestrator.
On an edge Node Details view, the widget displays WAN uplinks for the edge.