Identify and troubleshoot an interface that has a problem
By default, devices monitored by NPM are polled for data every nine minutes. It might take some time before all the nodes you added have data you can review.
Step 1: Determine there is a problem
In the topic Identify and troubleshoot a node that has a problem, alerts are triggered when a node goes down. Alerts can also be triggered when an interface has a problem, such as high utilization or the interface going down.
The Nodes with Problems widget provides information about the interfaces associated with each node. A square in the bottom-right corner of the node icon indicates that the node has an interface with a problem:
![]() - In this example, a red square indicates that one or more interfaces are down.
- In this example, a red square indicates that one or more interfaces are down.
![]() - In this example, a gray square indicates that the status of one or more interfaces is unknown.
- In this example, a gray square indicates that the status of one or more interfaces is unknown.
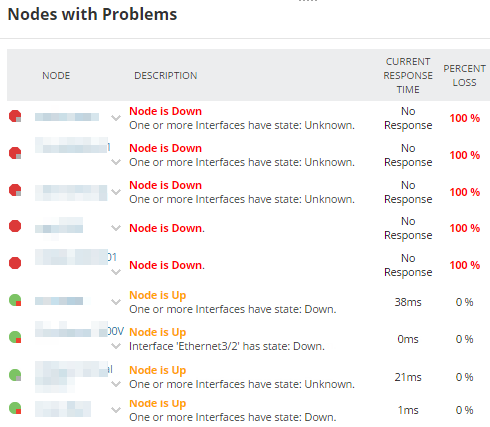
In your environment, you might not have any down interfaces. To find an interface with issues that need to be investigated, click My Dashboards > Network > Network Top 10 to open the Network Top 10 view. Review the following widgets on this page.
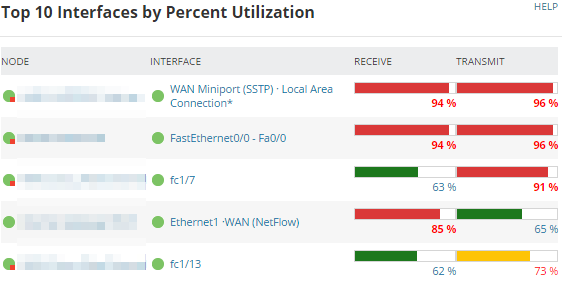
Top 10 Interfaces by Percent Utilization
This widget shows the interface’s transmit and receive utilization as a percent of total interface speed. By default, utilization rates from 70 - 90% are yellow (warning), and utilization over 90% is red (danger). These thresholds are configurable.
Any interface with high utilization deserves more investigation.
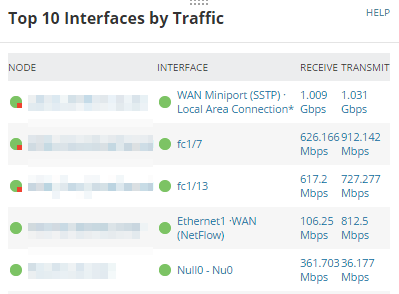
Top 10 Interfaces by Traffic
This widget shows how much actual traffic is on an interface. Usually, WAN interfaces will be on this list because of the volume of traffic they process.
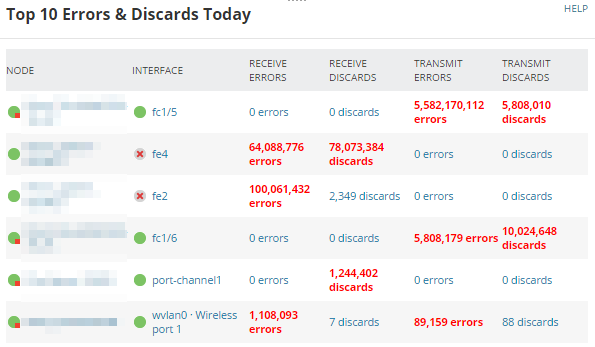
Top 10 Errors & Discards Today
This widget shows:
Errors: A packet that was received but could not be processed because there was a problem with the packet.
Discards: A packet that was received without errors but was dropped, usually because interface utilization is near 100%.
Step 2: Get more details about the interface
If an interface is down (red), that generally means there is no connection:
- Check the parent device to ensure it is operating.
- Check the cable for physical connectivity problems.
When you have found an interface with a problem (or, if all your interfaces are healthy, an interface with high utilization, errors, or discards), troubleshoot the issue:
Click the interface name in any widget. The Interface Details page opens.

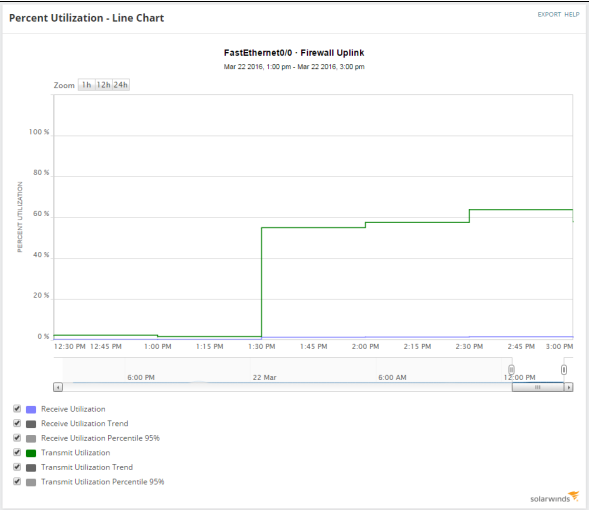
Check the Percent Utilization widget for the last-polled value of transmit and receive utilization. If those values are high, you can also check the Percent Utilization – Line Chart to see the duration of the problem.
The Interface Downtime widget displays the interface status for the last 24 hours. If the interface status changed, you can see it in this widget. In the following example, the interface had one period when its status was unknown during the last 24 hours, but it is currently up.

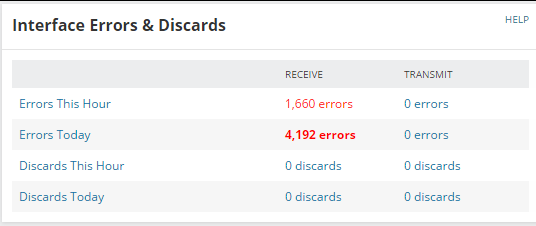
The Interface Errors & Discards widget can also indicate problems. Since this device has high discards, and high discards are generally caused by a full buffer, check the Node Details for this device and determine if the buffer is full.
Step 3: Get more details about the problem
The Node Details page can help you diagnose an interface problem. Click the node name at the top of the Interface Details page to open the Node Details page.

Examine the following widgets.
Min/Max/Average Response Time & Packet Loss
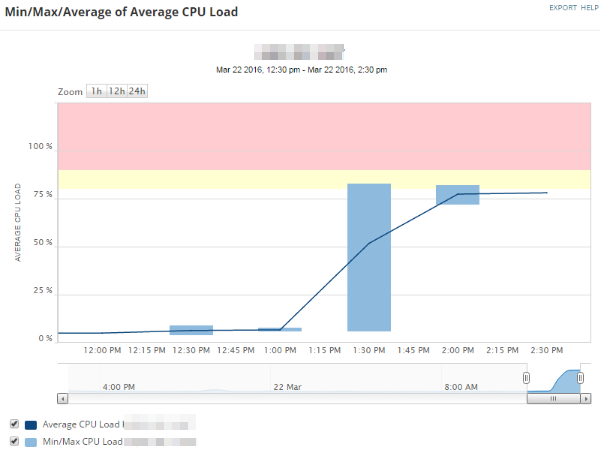
This widget shows the average load on the CPU for this node. In this case, the load spiked dramatically around 1:30 PM, which warrants further investigation.
Network Latency & Packet Loss
This widget shows the latency (response time) and packet loss for the entire node. A spike in response time occurred at the same time as the spike in the average CPU load (shown above), implying correlation between the events.
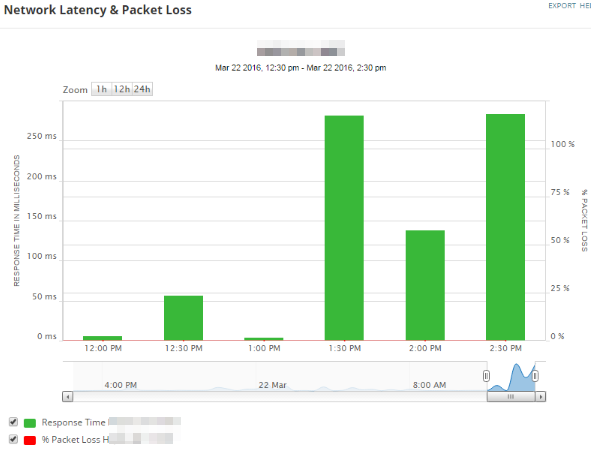
These widgets indicate an unknown increase in traffic that occurred at approximately 1:30 PM, leading to higher interface utilization, CPU load, and dropped packets. Values are not yet critical and no alerts have been triggered, and so it might not be a concern, but if you wanted to continue troubleshooting, you could perform the following actions:
- Determine if there were any configuration changes around that time. If you have Network Configuration Manager, you can use it to look up configuration changes.
- If you are monitoring traffic (for example, with NetFlow Traffic Analyzer), explore the cause of the traffic spike.
