Set up monitoring Cisco ASA firewalls
Data for monitoring Cisco ASA firewalls is polled by a combination of SNMP and CLI polling. To get accurate information, add the firewall device to NPM as a node, and provide CLI credentials.
What does CLI polling provide?
Enable CLI polling to receive additional ASA-specific details, and to display accurate information for your Cisco ASA devices.
For example, when polling Site-to-Site VPN tunnels, CLI polling helps filter data polled through SNMP, and display only relevant results. Without CLI polling, you might see failed access attempts from outside as failed tunnels.
Information polled by CLI
- Security level and standby IP address for interfaces
- Number of failed connections per minute on the ASA
- High availability details:
- Configuration sync state
- Connection sync state
- Standby state
- High availability mode
- Last failover date and time
- System HA type and system HA role
- Peer interfaces
- Firewall mode, serial number, and contexts on the ASA device
- All configured Site-to-Site tunnels on the ASA, including inactive tunnels
- For Site-to-Site tunnels, local IP address, local host name, remote IP address, and remote host name
Requirements
| Requirement | Details |
|---|---|
| Version |
Cisco ASA 8.2 and later Cisco ASA Services Modules are not supported. |
| User account | Credentials for logging into ASA device |
| Enable password | Credentials for polling CLI details. Without this password, you can access the ASA, but cannot poll it. |
| SSH port |
By default, port 22. Open an SSH port for accessing and polling ASA devices through SSH. |
Add firewalls using CLI credentials
You need Node Management Rights. See Define what users can access and do.
-
Click Settings > Manage Nodes, and then click Add Node.
-
Enter the IP address for the device.
-
Select Most Devices: SNMP and ICMP as the polling method, and enter SNMP credentials.
-
Choose resources and add pollers if necessary. You can keep the default settings.
-
On the Change Properties screen, enable CLI monitoring:
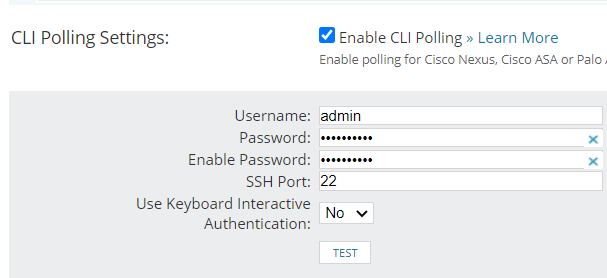
- Scroll down to CLI Polling Settings.
- Select Enable CLI Polling, enter the credentials, and click Test.
Enter a user name and password for logging into the device.
If you have configured a security password for CLI polling on the device, provide it in Enable password. Without the Enable Password, CLI polling does not work.
-
To use a specific device template, select it. Device templates are sets of commands you can execute on a device. See NCM Getting Started Guide for more information.
-
Complete the Add Node wizard.
You can now view the polled ASA firewall information in NPM.
Enable CLI polling on monitored devices
To poll firewall-specific data on ASA devices already monitored in NPM, enable CLI polling for ASAs.
- On the node details view, click Edit Node in the Management widget.
- Scroll down to the CLI Polling Settings section.
- Select Enable CLI Polling, enter the credentials, and click Test.
- Click Submit.
You can now poll firewall-specific information, such as platform, interface and tunnel details. Pollers for Network Insight are enabled.
Troubleshoot CLI polling
If CLI polling has issues, verify the following:
- You have enabled CLI polling on the ASA device.
- You are using the correct user credentials to log in to the ASA device.
- You are using the correct password for CLI access.
- You have enabled NetInsight pollers:
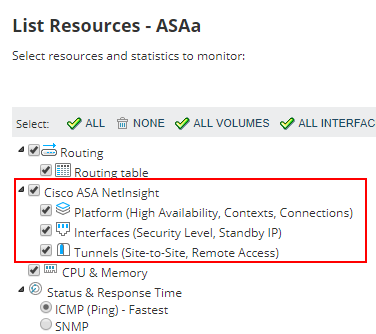
- On the node details view, click List Resources in the Management resource.
- Expand Cisco ASA NetInsight, and select to enable the pollers.
- Enable the CLI session trace to extend logging:
- Click Settings > All Settings > CLI Settings in the Product Specific grouping.
- Click Enable Session Tracing, and click Submit.
Review the session trace files located at:
%ALLUSERSPROFILE%\Application Data\SolarWinds\Logs\Orion\CLI\Session-Trace