Create and manage custom resource metrics in DPA
DPA provides a set of default metrics, but you can also add custom metrics to track other values that are meaningful to your organization.
Types of custom metrics
You can create two types of custom metrics:
- Query-based custom metrics use a query to determine the metric value.
- Custom wait time metrics track a specific wait type or event.
Query-based custom metrics
For query-based custom metrics, the metric definition includes a query that returns a positive integer. The metric chart shows one of the following values:
- The value returned by the query
- The delta between values returned by subsequent query executions
- The rate of change between query executions
- The time it took to run the query
In addition to the query, the query definition also specifies how often the SQL runs, the units, and which tab on the Resources page displays the metric (either a default tab or a custom tab). You can also specify default thresholds. If thresholds are set, users can create resource alerts on these custom metrics just as they can on default metrics.
To prevent unauthorized users from entering malicious SQL in a custom metric, you can configure password protection for this feature.
Examples of custom query-based metrics
Query-based custom metrics are flexible and can be used to track a wide variety of data. You can find examples of custom metrics that DPA users have created and shared through the DPA Content Exchange in THWACK. Some examples of how custom metrics can be used include:
-
Track the fragmentation of a heavily used index. Fragmentation causes index data to become out of order on the disk, with gaps between index data. For large tables this can cause slow performance when the index is read using a scan operation.
-
Monitor the number of buffer manager page reads per second in SQL Server database instances. If this value is high, the buffer manager is doing a lot of work flushing out old pages and reading in new pages, which can affect performance.
-
Monitor the number of page splits occurring in SQL Server instances. Page splits occur when new data is being added to a page, and that page lacks the space to store it. A large number of page splits can affect performance.
Custom wait time metrics
Custom wait time metrics track the amount of time a monitored database instance spends on a specific wait type or event. DPA gets the data shown on these metric charts from the DPA repository database. The metric definition specifies the wait type or event, but it does not specify the SQL.
Some options that are available for query-based custom metrics cannot be set for custom wait time metrics:
- You cannot select which tab displays a custom wait time metric. These metrics are shown on the Waits tab, in alphabetical order below the default Total Instance Wait Time metric.
- The unit is seconds.
- Thresholds cannot be set.
- Frequency and timeout cannot be set.
Create a query-based custom metric
-
From the DPA menu in the upper-right corner, click Options.
-
Under Monitor Setup > Report, Metrics & Alerts, click Custom Metrics.
The Custom Metrics page lists any existing custom metrics.
-
Click Create new custom metric.
The Custom Resource Metric Configuration page opens.
-
Enter the Metric Properties:
-
Leave Enabled selected if you want DPA to display the metric chart and collect data for this metric.
If you disable the metric, the metric chart is not shown on the Resources page and DPA does not collect metric data. The metric definition is available and you can enable it later.
-
Select the database type that the metric applies to.
-
If the SQL to collect data for this metric cannot be run on all versions of the selected database type, open the Database Versions drop-down menu and choose Limit versions. Then specify one of the following:
- The minimum version and above
- The maximum version and below
- A range of versions (inclusive)
The SQL Server version number does not always match the advertised version. For example, SQL Server 2017 has a version number of 14. For information about finding the version number, see How do I find SQL Server version.
-
As the Display Name, enter a name to identify the metric chart.
-
(Optional) Enter a description to be shown as a tooltip.
-
In the Category drop-down menu, specify which tab on the Resources page displays the metric chart:
-
To add the metric to an existing tab, choose a category from the menu.
-
To create a new category, choose Create New Category. Then enter the category name.
When at least one enabled metric is assigned to a custom category, the Resources page displays a tab for the custom category. If all metrics assigned to a custom category are disabled, the tab is not shown.
-
-
If necessary, enter information in the Units text box to clarify the unit of measurement (for example, MB, %, KBs/s, or days). This information is shown in parentheses after the display name.
-
If the metric is a percentage, select Chart as a Percent.

-
-
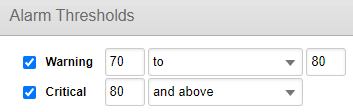
(Optional) If there are industry-standard or organizational thresholds that this metric value should not cross, specify the default thresholds in the Alarm Thresholds section.
-
Select the levels you want to enable.
-
For each level specify either the minimum value and above, the maximum value and below, or a range.
If you enable both the Warning and Critical threshold levels, enter the same value at the intersection of the two levels (as you would with thresholds for default metrics).
The resource metric chart indicates when these thresholds are violated. You can also create alerts on the metric based on the thresholds. The default thresholds can be overridden globally or for a specific database instance.
-
-
In the Metric Query section, define the query to run and the results to display:
-
From the Type drop-down menu, select a type to specify how DPA determines the metric value.
-
In the Frequency text box, enter the number of seconds between query executions.
-
In the Timeout text box, enter the number of seconds after a query execution that DPA should wait for results before it times out.
-
In the SQL text box, enter the query to execute. The query must:
- Contain valid SQL for the selected database type.
- Return a positive integer.
- Return only one value.

-
-
Test and save the metric:
- Click Test Metric.
-
Select the monitored instance to test on. For Delta and Rate Calculation metrics, specify the interval to use for the test. Then click OK.
DPA runs the SQL (twice for Delta and Rate Calculation metrics) and displays the results. If errors occur, correct the SQL and retest.
-
Click OK to close the results dialog box.
-
Click Save to save the metric definition, and then click OK at the confirmation dialog box.
Create a custom wait time metric
-
From the DPA menu in the upper-right corner, click Options.
-
Under Monitor Setup > Report, Metrics & Alerts, click Custom Metrics.
The Custom Metrics page lists any existing custom metrics.
-
Click Create new wait time metric.
The Wait Time Metric Configuration page opens.
-
Leave Enabled selected if you want DPA to display the metric chart.
If you disable the metric, the metric chart is not shown on the Waits tab of the Resources page. The metric definition is available and you can enable it later.
-
Select the database type that experiences the wait type or event.
-
If all versions of the selected database type do not experience the wait type or event, open the Database Versions drop-down menu and choose Limit versions. Then specify one of the following:
- The minimum version and above
- The maximum version and below
- A range of versions (inclusive)
-
As the Display Name, enter a name to identify the metric chart.
-
(Optional) Enter a description to be shown as a tooltip.

-
In the Wait Name text box, identify the wait type or event.
DPA does not verify that the Wait Name entry is valid. If the entry does not represent a valid wait type, or if the wait type does not occur on the selected database type, the metric chart always shows 0.
To search for a wait type:
-
Click Search next to the Wait Name text box.
-
Verify that the selected database is the correct type and version.
-
Enter part of the wait type name as a search string, and click Search.
-
Select an item from the Search Results and click OK.

-
-
Test and save the metric:
- Click Test Metric.
-
Select the monitored instance to test on and click OK.
DPA shows how much time the selected database instance spent on that wait type.
-
Click OK to close the results dialog box.
-
Click Save to save the metric definition, and then click OK at the confirmation dialog box.
Edit a custom metric definition
For query-based custom metrics, you can edit any values in the metric definition. For custom wait time metrics, you cannot change the Database Type or Wait Name values after the metric definition has been saved. If those values need to be changed, create a new wait time metric.
-
From the DPA menu in the upper-right corner, click Options.
-
Under Monitor Setup > Report, Metrics & Alerts, click Custom Metrics.
The Custom Metrics page lists existing custom metrics.
-
Click the name of the metric you want to edit.
The Custom Resource Metric Configuration page opens.
-
Make changes to the metric definition and click Save.
Delete a custom metric
-
From the DPA menu in the upper-right corner, click Options.
-
Under Monitor Setup > Report, Metrics & Alerts, click Custom Metrics.
The Custom Metrics page lists existing custom metrics.
-
Locate the metric and click the Delete button in that row. Then click Yes at the confirmation prompt.