View the status and history of DPA alerts
You can view the status of currently active alerts, and drill in to see alert details and history.
-
From the DPA menu in the upper-right corner, click Alerts.
The Current alert status page shows information about DPA alerts that are currently active.
-
An icon indicates the current status (for example, High, Medium, Normal, or Broken).
This page does not show alerts with the following statuses: Not Run, Unknown, and Inactive.
-
The
 icon identifies alerts that have been acknowledged. Hover over the icon to see who acknowledged it, when, and any comments.
Alerts with a status of Normal cannot be acknowledged.
-
Hover over the Status changed value to see when the alert was last evaluated.

-
-
To find the alerts you are interested in:
-
Select one or more filters from the Filters list.
-
Enter a string in the Search text box to search for an alert name or database instance name.
-
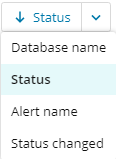
Select an option from the drop-down menu above the list to change the sort order. By default, alerts are sorted by status.

-
View alert details and history
-
To display additional information about the alert, do one of the following from the Current alerts status page:
- Click the alert name.
- Click the vertical ellipsis (
 ) on the right and choose Details and history.
The Alert details page displays the alert's current status, definition, and history. The History section lists the dates and times when the alert status changed or when the alert was acknowledged or unacknowledged.

-
If there are multiple values, hover the Current value to display the values for each database instance that triggered the alert. Click a line with a blue arrow to display details about that value.

-
To filter items in the History section, expand the Filters pane on the left.

-
Click the > on the left side of an item in the History section to see the list of evaluations at this status.

