Use PerfStack™ with SRM
The Performance Analysis dashboard (PerfStack™) enables you to correlate historic data from SRM and many SolarWinds products in a single view. This makes it simple to troubleshoot issues, create ad-hoc reports, and make data-driven decisions on infrastructure changes.
Drag and drop performance metrics, events, and log data to a chart to perform deep analysis of what was going on in your environment when an issue occurred. Stack or superimpose metrics to immediately see correlations across your infrastructure.
The entities and metrics available to you depends on the SolarWinds products installed.
Depending on your account limitations, you may not have access to your complete infrastructure data set. However, all users can create Performance Analysis dashboards.
Create Performance Analysis dashboards
- Click My Dashboards > Home > Performance Analysis to display the Performance Analysis dashboard.
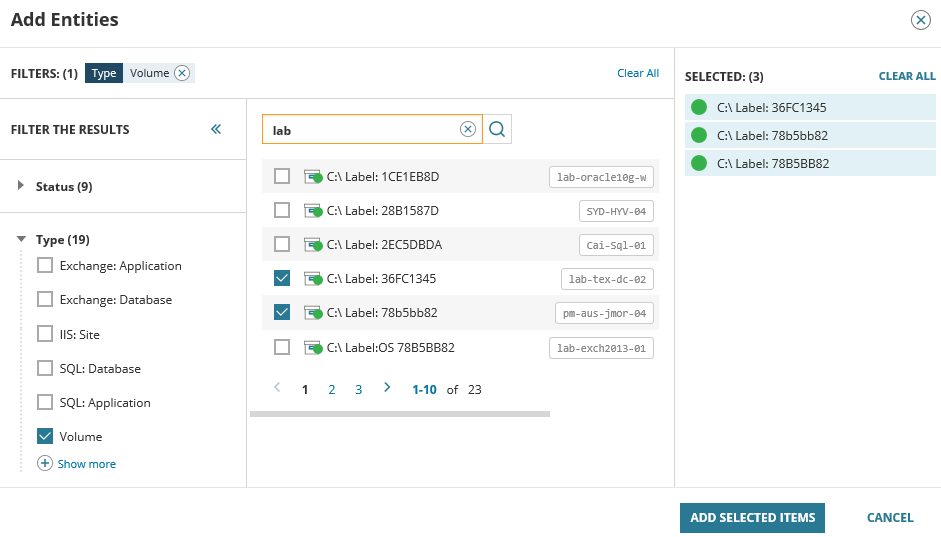
- Click Add Entities.
This opens the Add Entities window where you can filter and search all the available entities and select those you want to use.

- Click Add Selected Items to close the window.
The selected entities are now displayed, and organized by category.
- Click a gray triangle to expand an entity category.
To add all entities related to an entity, hover over the entity, and click the
 icon.
icon. - Highlight an entity to display the available metrics.
Metrics are organized by categories.
- Click a gray triangle to expand a metrics category.
- Drag a metric to the right area of the page and drop to create a new chart.
Note that you can drop this metric above, below or onto the existing chart.
- Repeat with additional entities and metrics to build the required charts.
- Click the time range above the chart to set the time range for the chart. This can be relative (for example, Last 24 hours) or a specific date and time span.
- Save the project.
Performance Analysis projects and changes to these charts are not automatically saved. If you create a new project or navigate away from the dashboard, any changes made since you last saved the project are lost.


Share Performance Analysis projects
Any saved analysis project can be shared by other users. Click Load to search for saved projects. Use other users' projects "as-is," or as the basis for new projects.
Projects you have not created can only be saved using More > Save As.
You can only delete projects you have created. If a user creates a project and is removed from the SolarWinds user list, the projects that user saved are not removed from the server.
You can also share the URL of a project. For example, you may use PerfStack™ to identify the root cause of an issue you are experiencing, and send the URL in a help desk ticket for a technician to view.
Troubleshooting
I do not see all the data I expect
The collected data depends on the products you install and how they are configured.
I do not see key entities
Performance Analysis charts respect account limitations. If your account is restricted from viewing certain entities or nodes, you cannot view their data in Performance Analysis dashboards.
Not all metrics I add are charted or data does not display correctly after I add more metrics
This is usually due to browser limitations. Changes to the Performance Analysis dashboards are reflected in the URL. If you have a large amount of data, the URL may exceed the character limit for URLs in your particular browser.
