SRM widgets
The SolarWinds SolarWinds Platform Web Console gives you access to dashboards with widgets that use charts and tables to visually convey current and historic storage data, using visually impactful charts and tables.


|
Hover over a highlighted object to display a popup showing current information. Click on the object to navigate to its detail page. |

|
For widgets containing tables or lists, a search box is available. Only the first column of data in the table is searched. |

|
Click Edit to customize the widget. |

|
Click Help to open the online help topic for this widget. |
You can configure the default widgets on the Storage Summary, Performance Dashboard, and Capacity Dashboard. Select from over 60 widgets specifically provided for SRM to create a personalized dashboard.
The Getting Started Monitoring File Storage for EMC VNX Arrays widget is unique in that it does not show data, but enables you to quickly add storage devices to be monitored.
Add a widget to a view
You can easily customize a dashboard or view by adding additional widgets.
- From the view to which you want to add the widget, click the Customize Page icon
 in the upper left.
 - Click Add Widgets in the upper right corner.
The Add Widgets view is displayed.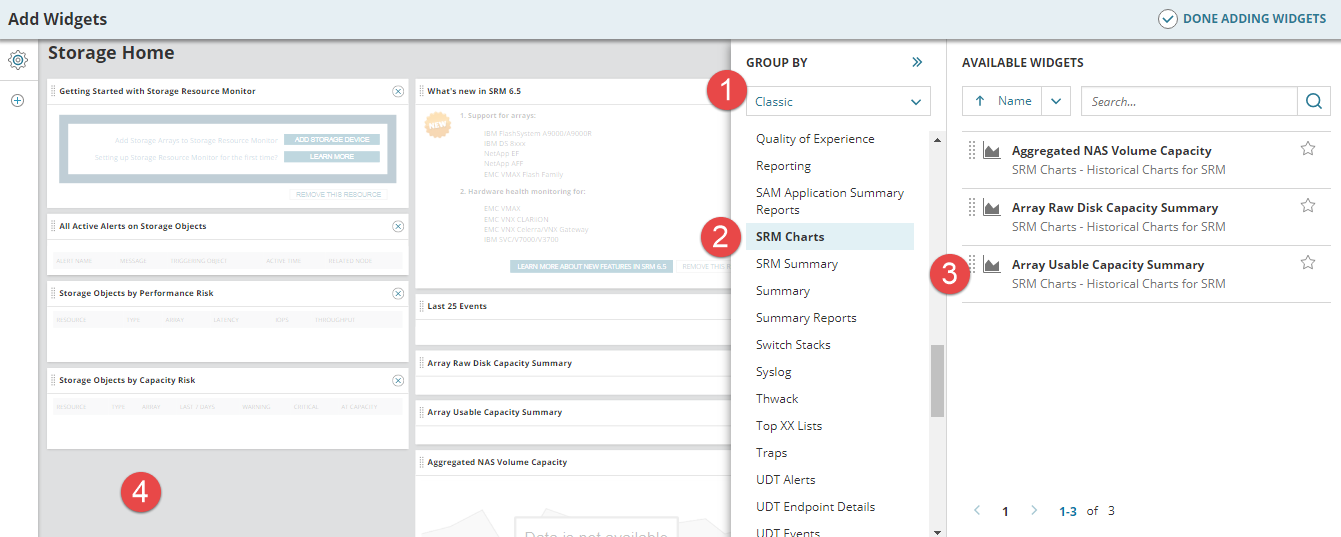
Select how you want to group the widgets for display. This can be by Type, by Feature or Classic. Select the widget group from the resulting list. Drag the required widget... ... to where you want it to appear. This can be between existing widgets. - Add further widgets as required.
- Click Done Adding Widgets.
- The Customize Page view is displayed.
- Click Done Editing.
You can have multiple copies of the same widget on a page if you have edited them to show different information. Use the Title and subtitle settings to differentiate them.
For more information on managing views and widgets, see Views and widgets in SRM .