Investigate a performance issue using AppStack
This example uses AppStack with SRM and SAM An alert has been triggered because an application has entered a critical state. Use Appstack to determine what caused this alert.
- Navigate to My Dashboards > Summary to display the All Active Alerts widget.
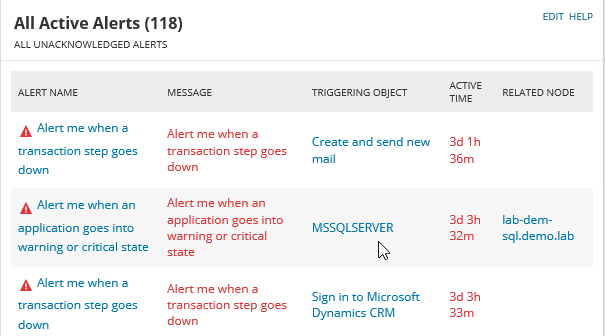
- Move the cursor over the triggering object name to see a snapshot of information about the object. In this example, the SQL application is reporting high read latency across many databases.
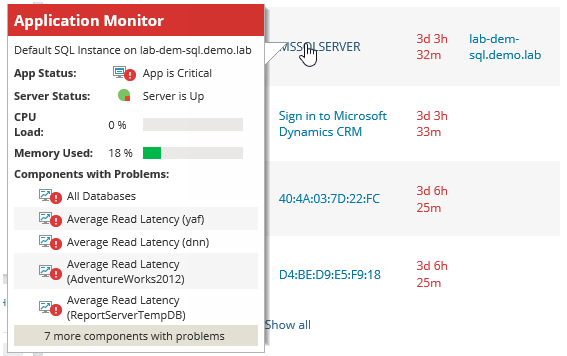
- Click the triggering object name to display the application details page.
The AppStack environment shows the infrastructure on which the SQL server depends. The server is up, but one or more interfaces is down, and the LUN that the SQL server uses is in a critical state.
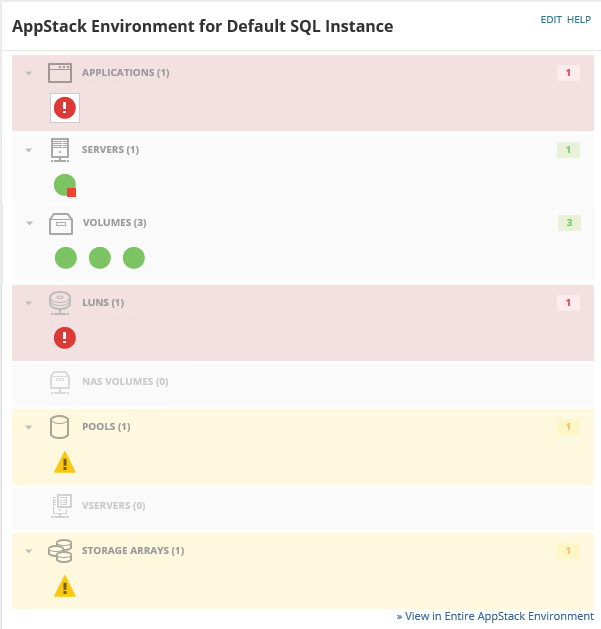
- Move the cursor over the LUN icon to show more information.
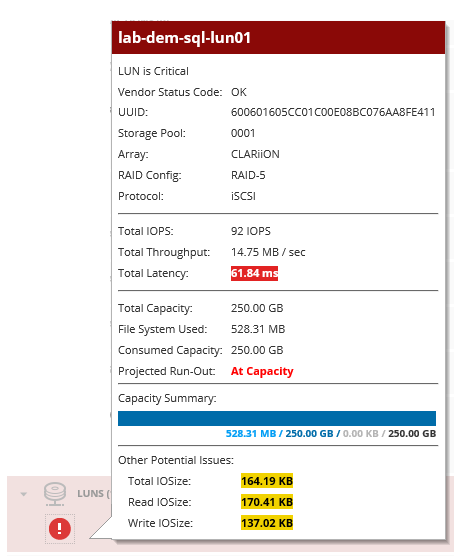
- Click the LUN icon to display the LUN details page. The Performance Summary widget shows the high latency.
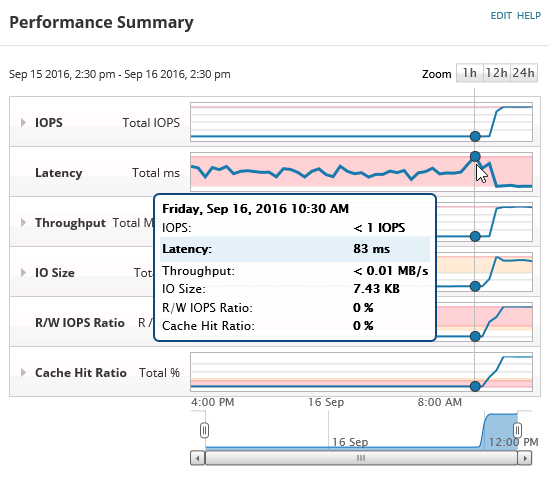
- Look at the Latency Performance Per Related LUNs on the same page.
You can see that the related LUN tex-esx-02_Lun13 is also showing high latency. This is known as a noisy neighbor, an object making demands on resources that adversely affects other objects in the same pool.
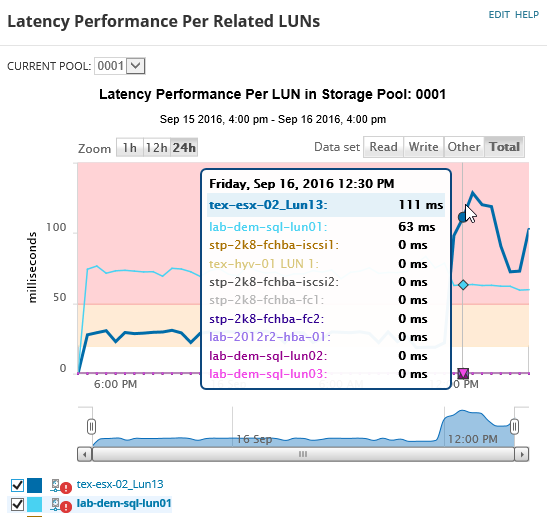
In this example, tex-esx-02_Lun13 is a database in query that is not supposed to be running at this time, so you could get with the database team to stop it or investigate if requirements have changed.
