Add an array to SRM for monitoring
After you have enabled an array, you can add it to SRM for monitoring:
The credentials required for each array type can be found in the Knowledge Base articles linked from the What provider does my array use? table.
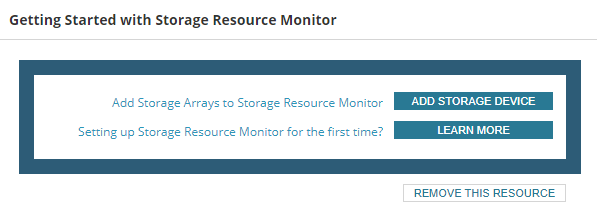
- Navigate to My Dashboards > Storage Summary, and click Add Storage Device on the Getting Started with Storage Resource Monitor widget.
If the Getting Started with Storage Resource Monitor widget has been removed from the dashboard, go to Settings > All Settings and click Add Storage Device in the Getting Started with SolarWinds Platform section.
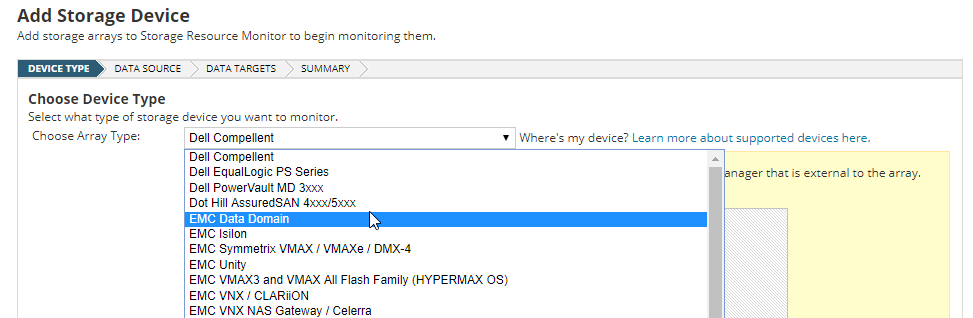
- Select the array type from the Choose Array Type drop-down menu, and click Next.
If you are running multiple pollers, select the poller to monitor this array and click Next.
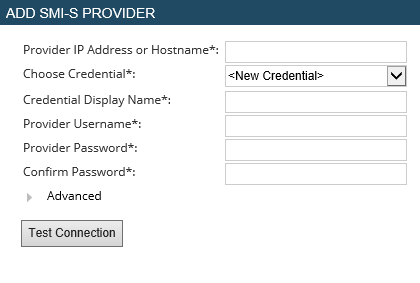
- Click Add SMI-S Provider on the Choose Data Source pane.
For some array types this label may be different or this step may be skipped.
- Enter the IP Address (or Hostname), and other information requested for the provider.
The fields displayed depend on the array type selected.
When you set up a provider, you need to create a Credential Display Name. This is displayed on the Choose Providers table shown above, so that you can select this provider in future.
- With some array types, you can change the default protocol ports and namespaces. Click Advanced to access these additional options.
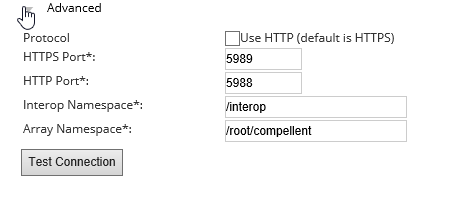
Ensure that the required ports are open between the polling node and the storage array.
- Click Test Connection. If SRM can connect to the provider, click Next.
If the test was unsuccessful, a message is displayed providing information about how to correct any errors.
When SRM connects to the provider, a discovery routine runs to find compatible arrays for the provider. When this has finished, the discovered arrays are listed.
Monitored arrays are also listed.
- Select the array to monitor and click Next.
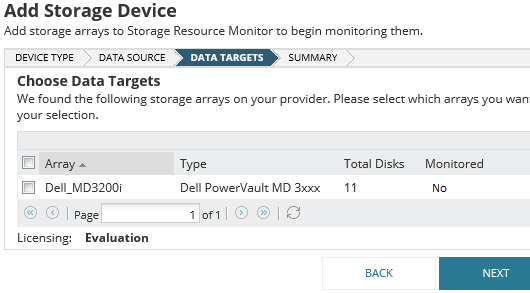
The Results page is displayed, showing licensing and poller information in addition to the array details.
- Click Finish.
The Storage Summary dashboard is displayed, showing data from the monitored array.