Troubleshooting performance issues
SRM widgets display a yellow or red background for monitored values that have reached warnings or critical levels. To get more information and determine the cause, drill down and click the storage resource.
The following scenario begins with a triggered performance alert, and then shows you how to identify the root cause of the issue.
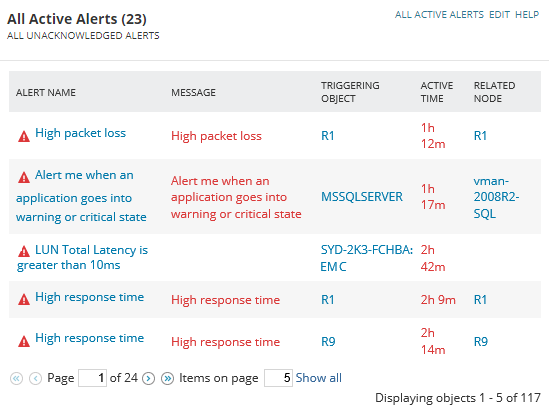
Go to the All Active Alerts widget to view all objects that have triggered alerts and need attention.
- Go to My Dashboards > Storage > Storage Summary to see the All Active Alerts widget. This shows current alerts for storage objects and all other objects monitored by SolarWinds.
In this example, an alert called LUN Total Latency is greater than 10ms has been triggered by SYD-2K3-FCHBA:EMC LUN.
The alert also shows how long it has been active.

- Move the cursor over the triggering object name to display information and any additional issues that exist for the LUN.
- Click on the name of the triggering object to open the details page.
- Go to the Performance Summary widget for a more detailed view of this specific LUN's latency issues in relationship to other metrics. By moving the cursor over the chart, you can see all the performance metrics at any given time during the last 24 hours.
- Click on a graph label to expand the information.
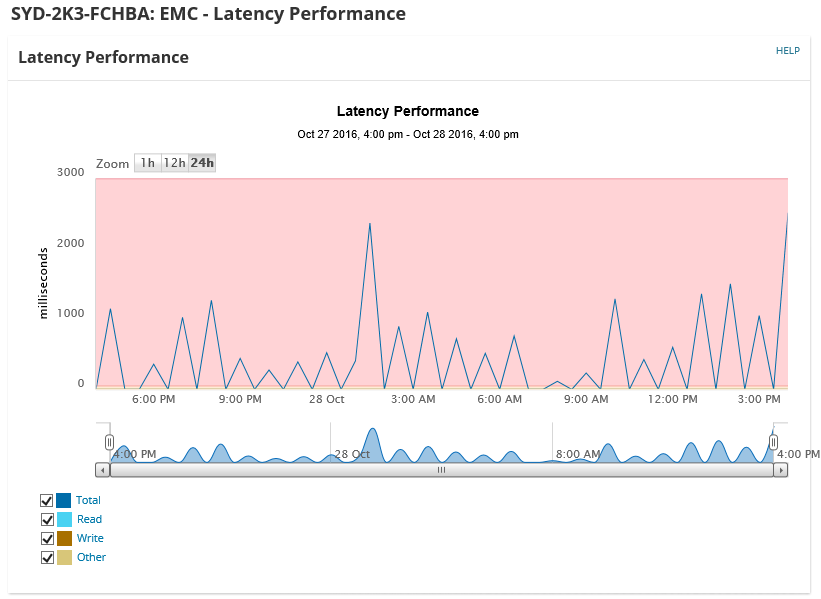
For example, clicking Latency opens the Latency Performance widget. This gives a more precise record of performance over time, so you can see exactly when problems are occurring.

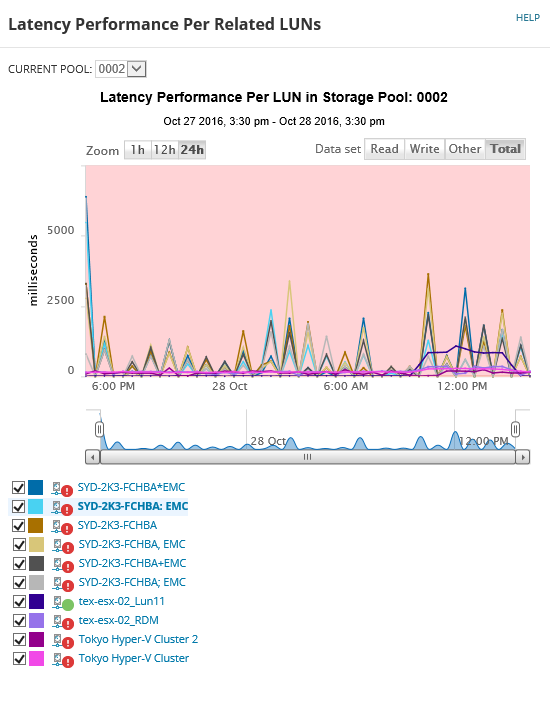
- Scroll down to Latency Performance Per Related LUNs.
This widget shows latency performance for the selected LUN, compared with other LUNs in the same storage pool over the required period. You can see which other LUNs (known as "noisy neighbors") have high latency at the same time as the LUN you are troubleshooting. Based on the information in this example you might want to:
- Reallocate the applications that use this LUN to another storage pool
- Add more widgets to the array

In this example it shows that not only is the device displaying high latency, but it has also reached total capacity. In some situations this might be enough information for you to take action, but in other you may need to investigate further.

The LUN Details widget provides technical information about the device, together with a number of performance resources.

You can zoom in or out between 24 hours, 12 hours, and 1 hour, as well as focus on the relevant time period using the slider bars below the chart.

