Player Load Percentage
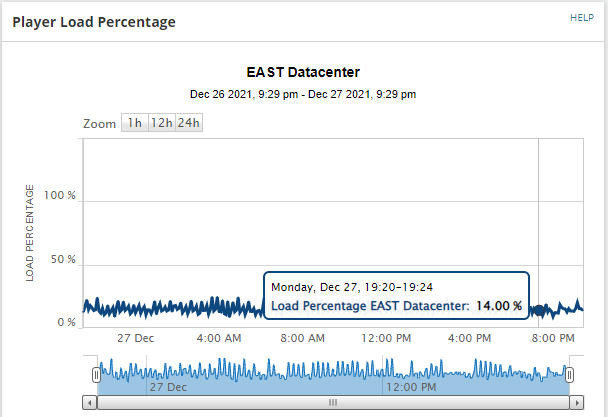
The Player Load Percentage widget on the Location Details page shows the load percentage of a system hosting an individual WPM Player at any given time. You can use this chart to estimate the number of transactions assigned to a transaction location. Hover over a data point to display an exact date, time, and load percentage.
This widget uses the following calculation to display data:
player_load = number_of_running_playbacks/total_number_of_playback_workers*100 + transactions_waiting_for_playback
Per the Scalability Engine Guidelines for SolarWinds Products, SolarWinds recommends limiting the number of monitored transactions assigned to a WPM Player to 12 or less. However, note that many factors can impact the load on transaction locations that host WPM Players, including:
- The complexity of assigned transactions.
- The length of playback for each transaction.
- The length of intervals between each transaction playback.
- The processor speed and RAM available on the system hosting the WPM Player.
- The number of WPM Player service accounts or domain accounts involved in playback. See Manage WPM Player service accounts.
You can check the WPM Player load on a remote system in the Player Load Percentage widget, as described in Display transaction locations in WPM.
To display this widget:
- Click Settings > WPM Settings > Manage Player Locations.
- On the Manage Transaction Locations page, switch to the Transaction Locations tab.
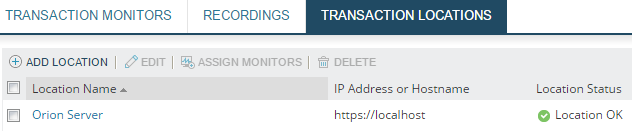
- Click a location to open its Location Details page.
Zooming
You can display data for 1 hour, 12 week, or 24 hours, or use the sliders below the chart to select your own period. You can also move the selected period to any point in the available data range.
Available customization
Click Edit to change the following widget attributes:
|
Title and Subtitle |
Rename the title and subtitle of this widget as required. |
|
Calculated Series |
Check the checkbox to show a trend line on the chart showing the overall trend of the load percentage. |
|
Time Period |
Select the default period of data displayed, the amount of historical data available and the sample interval. If the sample interval is greater than the playback interval, the data within the sample is summarized. |
|
Advanced |
Change the chart title and subtitle from the defaults of $(Caption) and $(ZoomRange). |