Network Devices and Router Logs
Loggly provides the infrastructure to aggregate and normalize log events so they are available to explore interactively, build visualizations, or create threshold-based alerting. In general, any method to send logs from a system or application to an external source can be adapted to send logs to Loggly. The following instructions provide one scenario for sending logs to Loggly.
Network devices like routers, switches, load balancers, intrusion protection systems, and more can output syslog which you can relay to Loggly. A centralized relay allows you to forward log events outside your local VPN, so you don’t need to open your devices to direct internet access. It also allows TCP for better reliability and TLS for security. It allows you to use the newer RFC 5424 syslog standard with structured data containing your customer token to identify you. Please choose either a Linux or Windows relay and then configure your devices to send to it.

Part 1: Linux Relay
1. Configure Syslog Daemon
Log into the server you want to use as your local relay. If you haven’t already, run our automatic Configure-Syslog script below to setup rsyslog. Alternatively, you can Manually Configure Rsyslog or Syslog-ng.
curl -O https://www.loggly.com/install/configure-linux.sh
sudo bash configure-linux.sh -a SUBDOMAIN -u USERNAME
Replace:
- SUBDOMAIN: your account subdomain that you created when you signed up for Loggly
- USERNAME: your Loggly username
2. Add UDP Input
Create a new UDP configuration file or open your existing one:
sudo vim /etc/rsyslog.d/22-udp-loggly.conf
Copy and paste this configuration to enable UDP input on the default syslog port 514.
# provides UDP syslog reception
$ModLoad imudp
$UDPServerRun 514
Restart rsyslogd so the changes take effect.
sudo service rsyslog restart
3. Send A Test Event
Try sending a test event to rsyslog using netcat to make sure it’s able to receive UDP messages.
echo hello | nc -u -w 1 localhost 514
This message should show up in your system log as well as in Loggly:
tail /var/log/syslog
4. Configure your Network Device
Go to the next section to configure your network device
Part 1: Windows Relay
1. Install Nxlog
If you haven’t already, install nxlog on the server you’d like to use as your local relay using this guide.
2. Add UDP Input
Open your nxlog.conf file in a text editor.
C:\Program Files (x86)\nxlog\conf\nxlog.conf
Copy and paste this configuration to enable UDP input on the default syslog port 514:
<Input udp>
  Module im_udp
  Host 127.0.0.1
  Port 514
</Input>
Go down to the bottom of the nxlog file and find the Route directive. Insert the new udp input leaving the other inputs in place. This will route the udp messages to Loggly.
<Route 1>
  Path udp, internal, eventlog => out
</Route>
Restart nxlog so the changes take effect. You can do this by opening the Services tool from the Start menu, selecting nxlog from the list, and clicking restart.
3. Configure your Network Device
Go to the next section to configure your network device.
Part 2: Configure Your Network Device
1. Send Logs From Your Device To The Relay
Get the IP address of your local relay and copy it.
ifconfig eth0
Refer to your network device’s documentation on how to send log events to a syslog server. Here are a few examples:
Juniper SRX Firewall / Security Device
Log into the SRX device, then run the following commands. Replace <relay ip> with the IP of your local relay server.
configure
set system syslog host <internal ip> any any
set system syslog host <internal ip> port 514
set system syslog host <internal ip> interactive-commands none
commit
exit
Arista 7050 10GB Switch
Log into each switch and run the following commands. Replace <relay ip> with the IP of your local relay server.
enable
configure
logging host <internal ip> protocol udp
send log level notifications message Your Test Message Here
2. Verify Events
Search Loggly for events from your network device over the past hour. It may take a few minutes to index the events. If it doesn’t work, see the troubleshooting section below.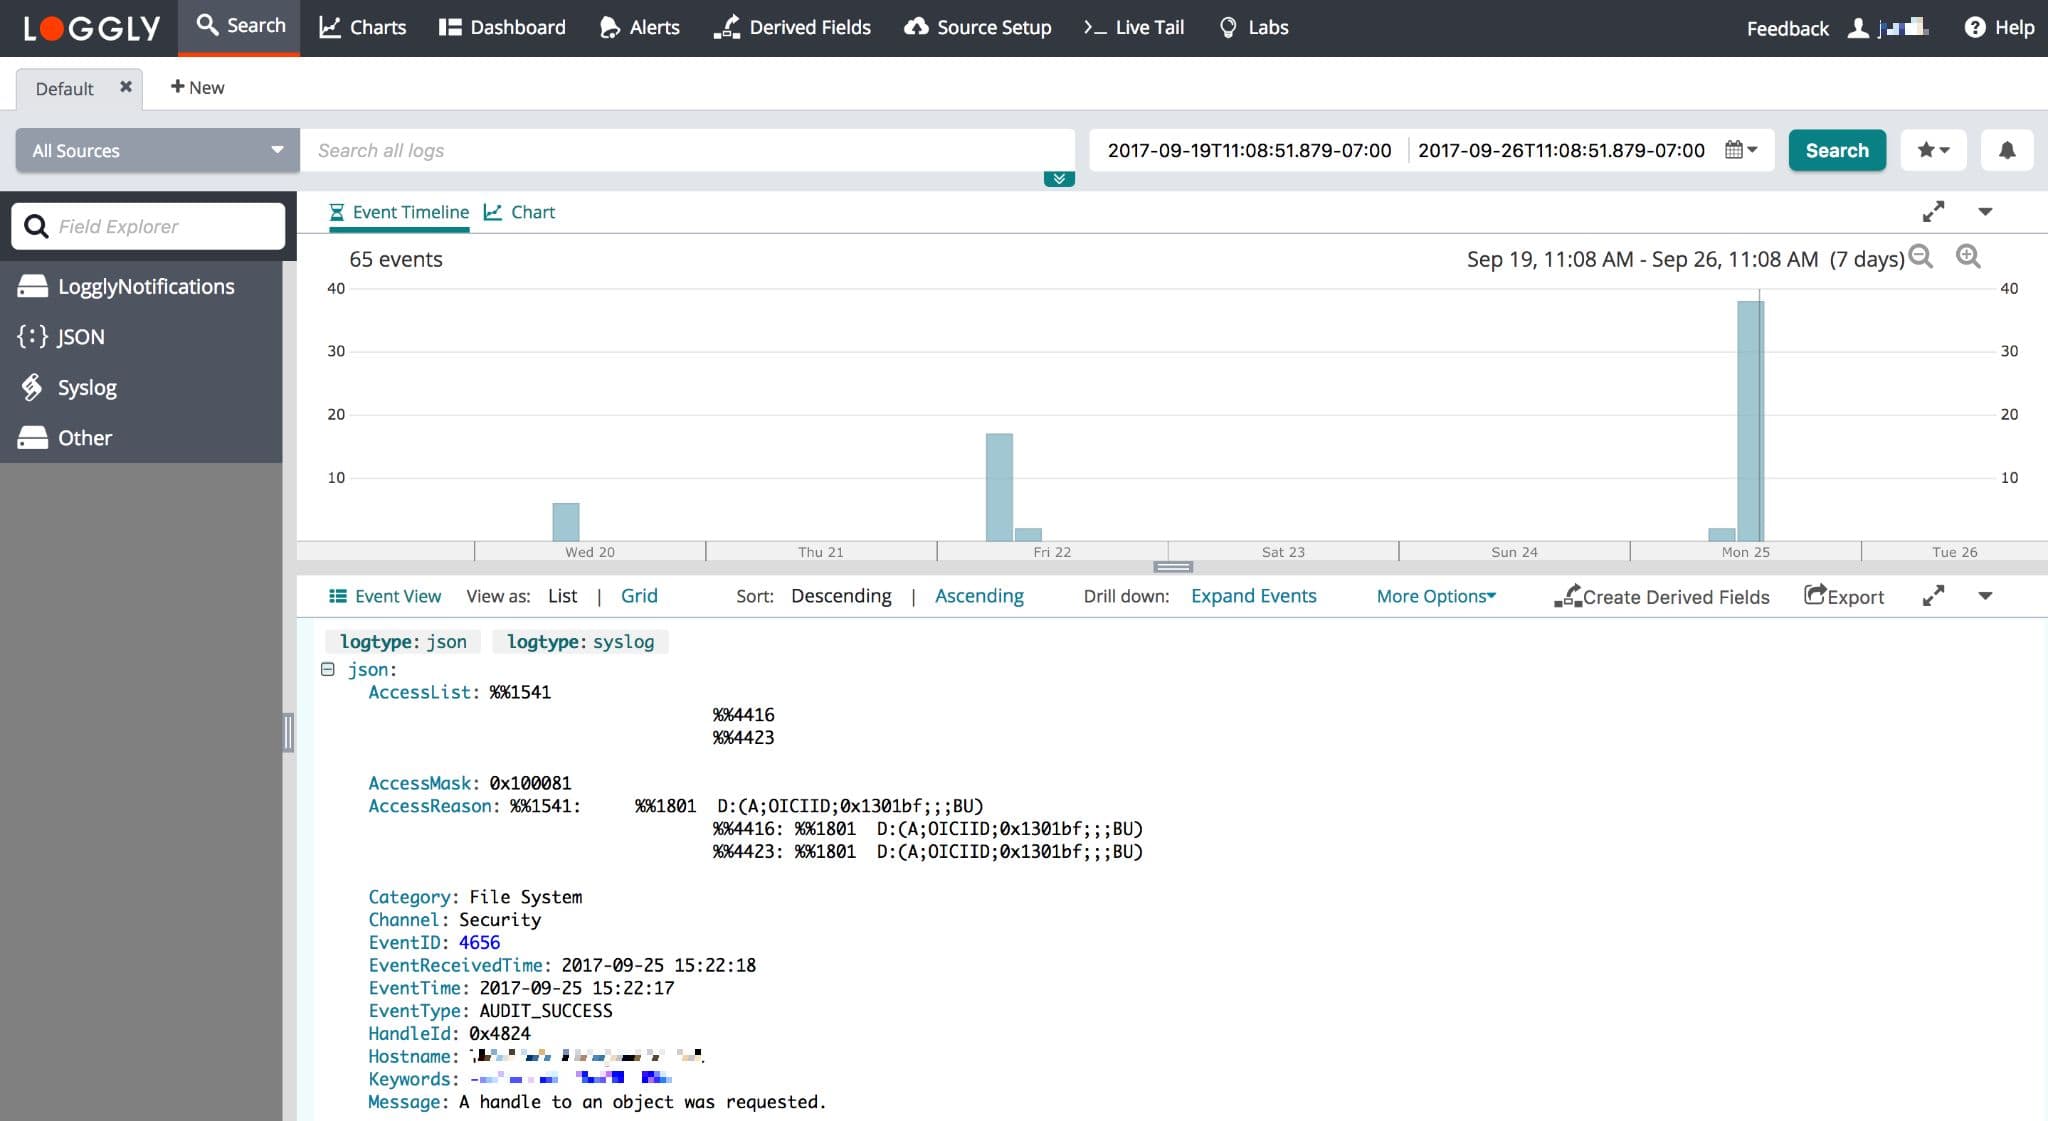
Advanced Router and Network Devices Logging Options
- Send secure syslog over TLS – encrypt the data transmission on rsyslog
Troubleshooting Network Devices and Router Logs
If you don’t see any data show up in the verification step, then check for these common problems.
Check Your Network Device
- Wait a few minutes in case indexing needs to catch up.
- Make sure your local aggregator server is receiving UDP messages from your network device using a packet capture look like tcpdump on Linux or Wireshark on Windows.
Check Your Syslog Daemon:
Still Not Working?
- Search or post your own router and network device logging question in the community forum.
The scripts are not supported under any SolarWinds support program or service. The scripts are provided AS IS without warranty of any kind. SolarWinds further disclaims all warranties including, without limitation, any implied warranties of merchantability or of fitness for a particular purpose. The risk arising out of the use or performance of the scripts and documentation stays with you. In no event shall SolarWinds or anyone else involved in the creation, production, or delivery of the scripts be liable for any damages whatsoever (including, without limitation, damages for loss of business profits, business interruption, loss of business information, or other pecuniary loss) arising out of the use of or inability to use the scripts or documentation.