Analyze Your Loggly Data
Navigation Notice: When the APM Integrated Experience is enabled, Loggly shares a common navigation and enhanced feature set with other integrated experience products. How you navigate Loggly and access its features may vary from these instructions.
Use charts, filters, and range searches to analyze your logs and find root causes of problems.
Chart Response Times
If your data sent to Loggly includes response time on query calls, you can use trend analysis to troubleshoot and find out why results are coming back slow.
Make sure your data set includes response time by performing a search. Select the source group defined earlier from the drop-down and enter the response times field in the search box. For example, to find response times in our sample data, enter this in the search box:
json.querytime_ms
Plot Maximum Response Time
To plot the maximum response time,
- Click the Chart link above the event graph.
- Select Chart Type as Line.
- Select Value Type Statistics.
- Select json.querytime_ms from the Numeric drop-down and Maximum from the Operator drop-down.
- Select the source group defined earlier from the Source Groups drop-down.
- Give the Series a Name.
The chart automatically zooms in on the part with data. You can see a few spikes where the responses came back slow.

Plot Average Response Time
To compare the maximum to the average response time, click + to add a second series.
- Select Value Type Statistics.
- Select the Field as json.querytime_ms and Operator as Average.
- Give the Series a Name, Avg Response Time

Narrow Results Further
Range searches and field filters zero in on the root cause of problems.
Range Search for Slow Responses
To find just the slow events, do a range search for responses over the SLA of 500ms. It must have an upper limit, so make it greater than the maximum response time to show all the slow events.
json.querytime_ms:[500 TO 10000]

Filter on Top Failures
To see why they are slow, expand the filter panel and navigate to the Failures field. Click the top failure code in the list to add the filter on that value.

Review Results
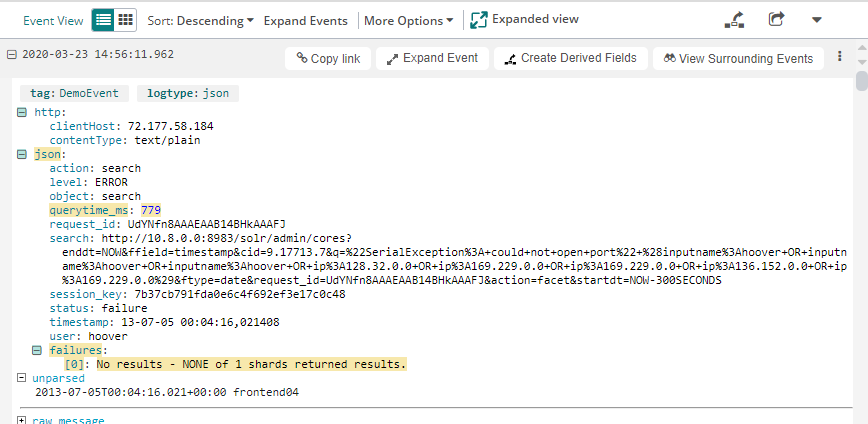
To learn more about events with this failure code, switch to the event view. Then click on an individual event to expand it and view the event details. You will see each field has been automatically parsed out. This is what enables the trend analysis and filters to work on individual fields or facets.
Next Steps
Now that you've found the root cause, Monitor Your Loggly Data to know immediately if the problem occurs again.
