Kubernetes Logging Through Logspout
Loggly provides the infrastructure to aggregate and normalize log events so they are available to explore interactively, build visualizations, or create threshold-based alerting. In general, any method to send logs from a system or application to an external source can be adapted to send logs to Loggly. The following instructions provide one scenario for sending logs to Loggly.
You can send Kubernetes pod logs to Loggly by using the popular open source tool called Logspout. Logspout pulls logs from Docker’s standard json log files. By using a DaemonSet, Logspout will be deployed across all nodes in your cluster, allowing logs from all nodes to be aggregated in Loggly. It does not allow multiline logs so each log line will be treated as a separate logging event. This setup has been tested with Loggly v3.2.4 and Kubernetes 1.7 and up.
Prerequisites:
- Loggly account
- Kubernetes cluster
Kubernetes Logspout Setup
1. Create a secret for your Loggly customer token
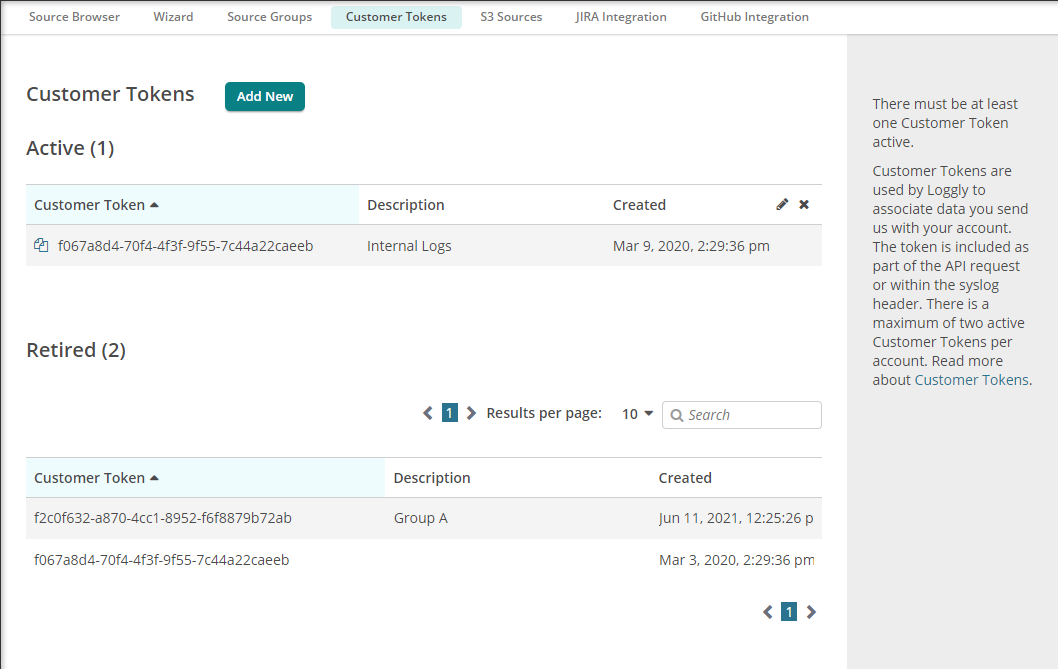
From the Loggly product, click on "Source Setup" in the main menu, and then "Customer Tokens" in the sub-menu to get to the customer tokens page. Use this token to create a Kubernetes secret containing the syslog structured data and endpoint for Logspout to use.

kubectl create secret generic logspout-config --from-literal=syslog-structured-data="$TOKEN@41058 tag=\"kubernetes\""
Replace:
- $TOKEN: enter your customer token before creating the secret.
2. Create the Logspout DaemonSet
A Kubernetes DaemonSet is a control structure for starting an instance of a pod on all nodes in a Kubernetes cluster. As your cluster scales, you won’t need to worry about starting more Logspout instances, since Kubernetes will take over starting and restarting pods as needed.
Run the command below to create a DaemonSet and start the Logspout pod on all of your Kubernetes nodes. The linked gist contains the DaemonSet manifest configured to use the secret we created in the first step, as well as annotations so that Loggly can parse the application and pod names as logs are received. You may run it as is or download it and customize it for your needs.
kubectl apply -f https://gist.githubusercontent.com/gerred/3cac803b9f8f581b22f562b509d897cf/raw/41cdccdc9364c3e82f9f90d925cc9b67417bf762/logspout-ds.yaml
3. Verify Events
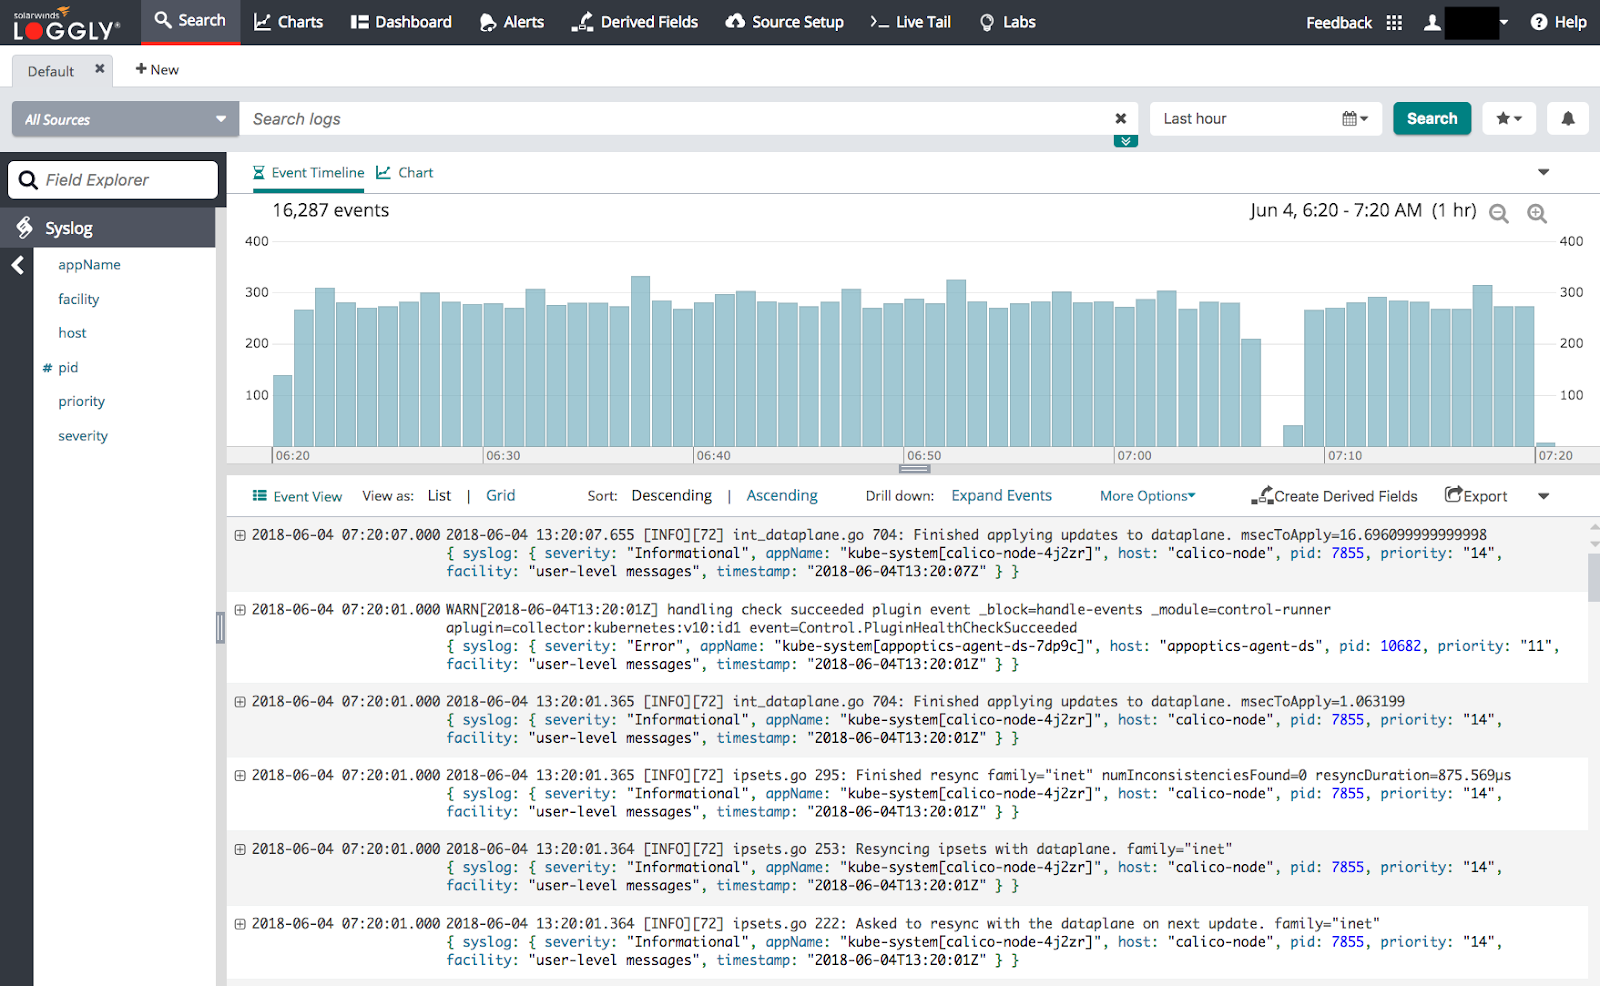
Go to the Search tab and search for events in the past 10 minutes. It may take a few minutes for incoming events to appear.

Aggregation of logs for multiple pods
Logspout collects logs of every Docker container running on the system and delivers them to Loggly. Logs for an individual pod are parsed as syslog.appName, while logs for all pods in a given application are parsed as syslog.host. When aggregating logs across multiple pods, key searches off of the syslog.host field. This will ensure that all logs for an application are captured.
Example: Centralizing nginx server logs with Logspout
Step 1. Check pod status
You should already have created the Logspout DaemonSet and can see the running pod status by running the command below:
[ec2-user@ip-10-0-0-244 ~]$ kubectl get pods -l name=logspout
NAME            READY   STATUS   RESTARTS  AGE
logspout-pwbw2  1/1     Running  0         17m
Step 2. Run Nginx container
Run the nginx container and expose it as a service using the command below.
kubectl run nginx --image nginx --port='80' --expose
Step 3. Start the kubectl proxy
Start the kubectl proxy and access the service proxy endpoints a few times to generate a few logs:
kubectl proxy &
curl https://localhost:8001/api/v1/namespaces/default/services/nginx/proxy/
Verify Events
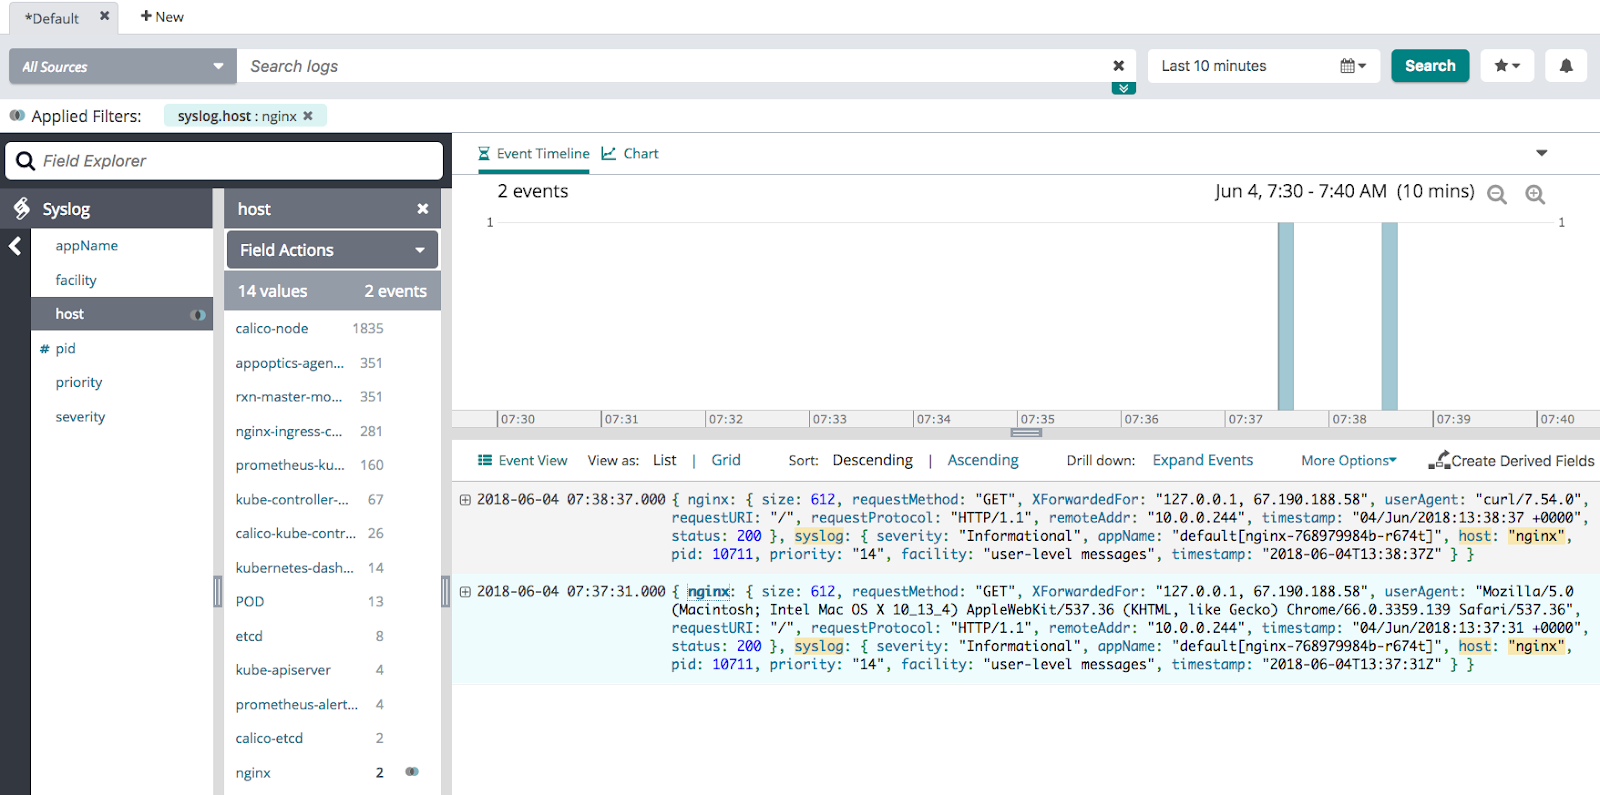
Search Loggly for events with the syslog.nginx host over the last 10 minutes. It may take a few minutes for events to be indexed. If no events show up, see the troubleshooting section below.
host:syslog.nginx

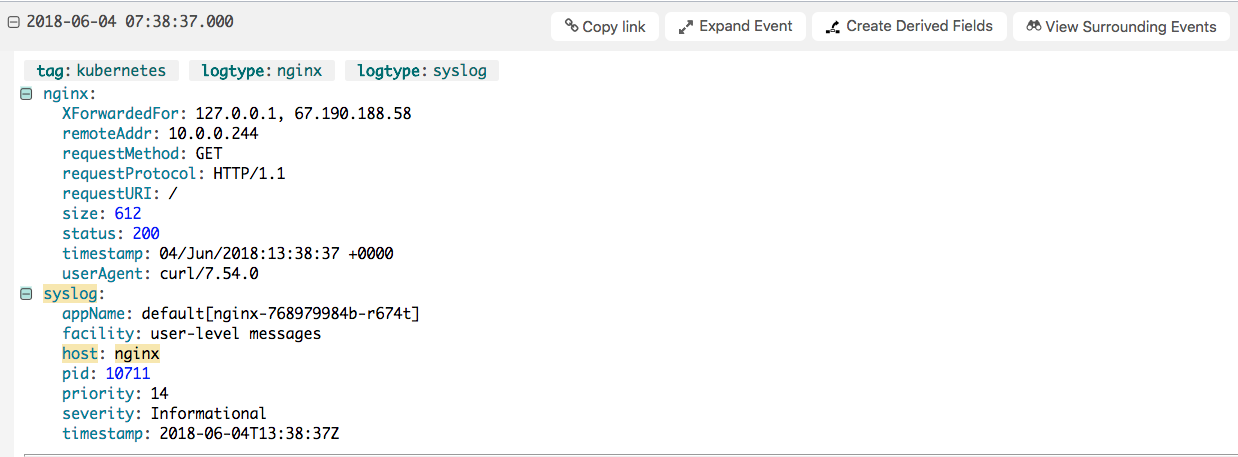
Expanding each individual log will show the details for a log event.

In the example above, Loggly has detected that these are nginx logs and parsed them to provide better information. The logtype will be set to both nginx and syslog representing this parsing, while the tag will be set to `kubernetes`. This tag can be changed by changing the tag in the syslog-structured-data part of the secret you created in the first setup step.
Kubernetes Logging Troubleshooting
If no data appears in the verification steps, check for these common problems:
Check Kubernetes Pods:
- Wait a few minutes in case indexing needs to catch up
- Verify the pod is running by running `kubectl get pods -l name=logspout`
- Make sure it can access the Loggly host by getting the logspout logs: `kubectl logs $POD_NAME`. Remember to replace $POD_NAME with the pod from the last troubleshooting step
- You can only relay logs with Logspout on Kubernetes clusters using the Docker with the json-file/journald drivers. Currently, containerd is untested and unsupported.
Still Not Working?
- Search or post your own Kubernetes logging question in the community forum.
The scripts are not supported under any SolarWinds support program or service. The scripts are provided AS IS without warranty of any kind. SolarWinds further disclaims all warranties including, without limitation, any implied warranties of merchantability or of fitness for a particular purpose. The risk arising out of the use or performance of the scripts and documentation stays with you. In no event shall SolarWinds or anyone else involved in the creation, production, or delivery of the scripts be liable for any damages whatsoever (including, without limitation, damages for loss of business profits, business interruption, loss of business information, or other pecuniary loss) arising out of the use of or inability to use the scripts or documentation.
