Dashboards
Navigation Notice: When the APM Integrated Experience is enabled, Loggly shares a common navigation and enhanced feature set with other integrated experience products. How you navigate Loggly and access its features may vary from these instructions.
Dashboards provide a single location for viewing all activity across your system for which log events are being sent. Dashboards allow you to create visualizations of the results of your search queries based on your log data. This may reveal issues and assist you in identifying issues your customers might be facing.
With the APM Integrated Experience, all AppOptics and Loggly dashboards are found in a single consolidated location. For more information about accessing and managing dashboards in the APM Integrated Experience, see Integrated Dashboards
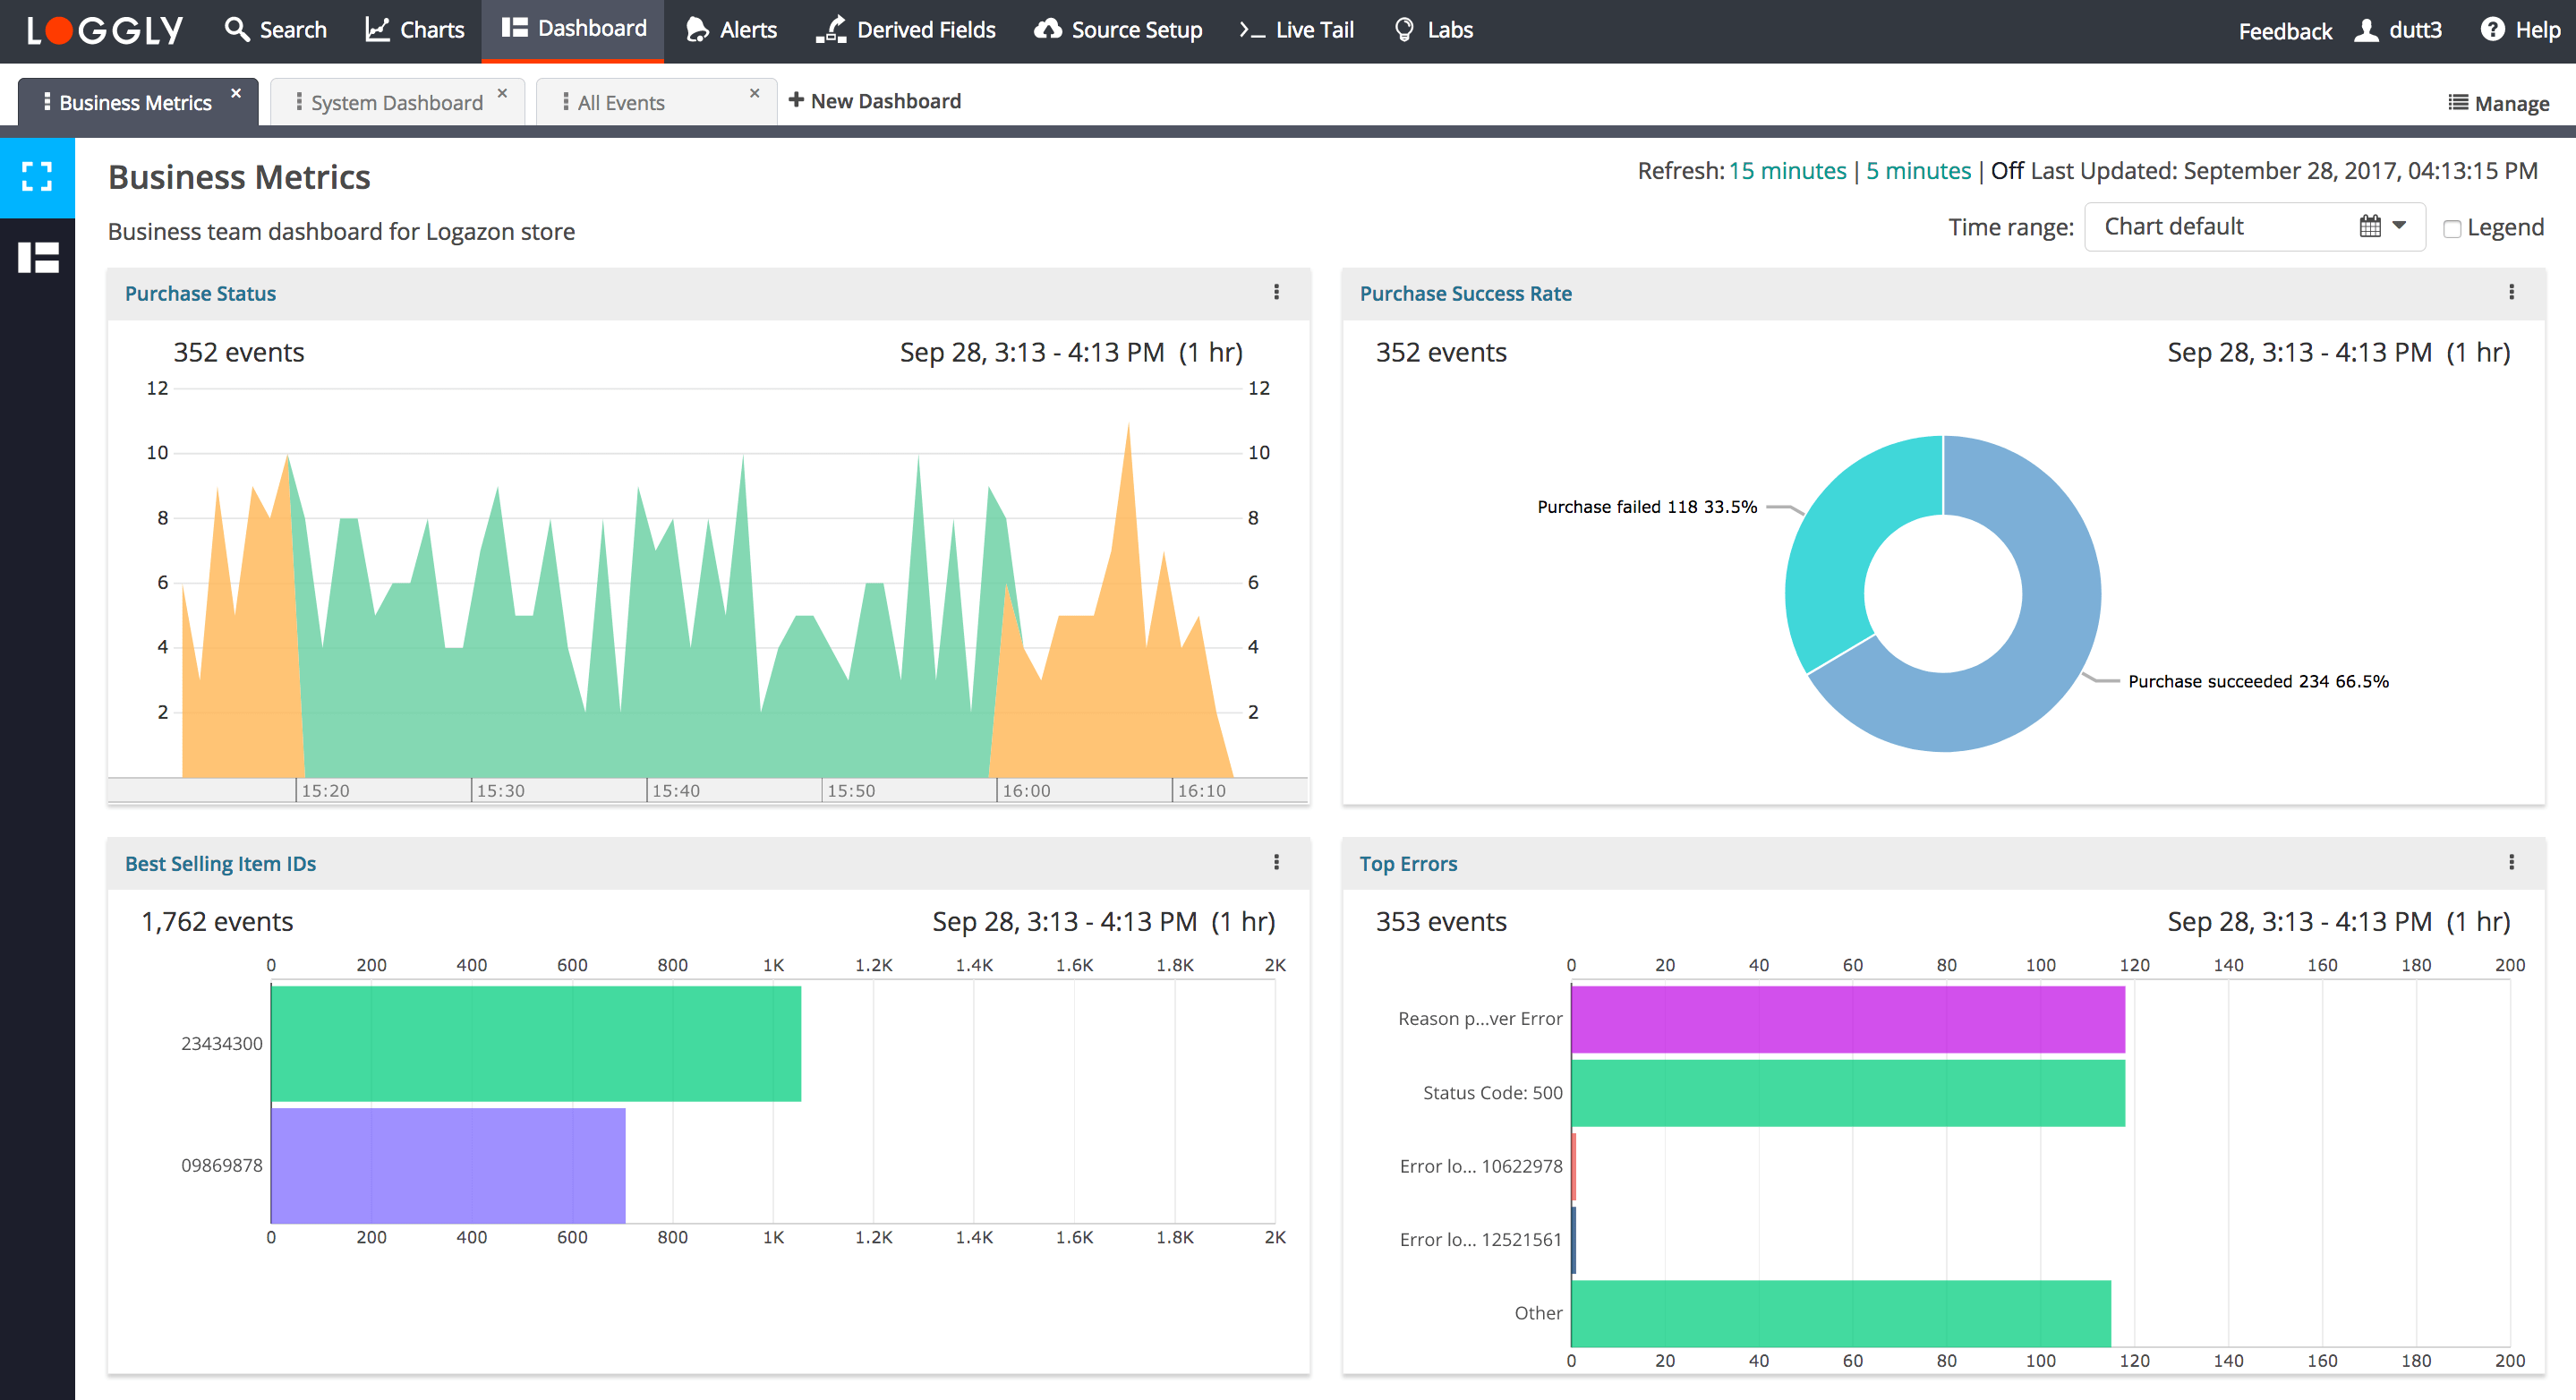
To access your dashboards, click the Dashboard tab in the navigation pane. If no open dashboards display, the Manage Dashboards screen displays as described below.
Managing Dashboards
The Manage Dashboards function allows an admin to quickly browse and manage all the dashboards in your account. You can find the Manage Dashboards option on the top right of the Dashboard page.

Dashboard Features
-
Search and Filter. The search box allows you to quickly find an existing dashboard. You can also filter the dashboards by clicking All, Updated last 7 days, or My dashboards. A dashboard name is unique to a given dashboard user. For example, Joe and Jill can each have a dashboard named My Dashboard. But Joe cannot have two dashboards named My Dashboard.
-
Opening a dashboard. You can add any dashboard to the Dashboard tab by selecting the dashboard name from the list and clicking Open. To view the dashboard, click its tab. If you have previously hidden or closed any dashboard by clicking the X on the dashboard tab, you can retrieve and display the dashboard from the Manage screen. You can also open multiple dashboards at once by selecting multiple check boxes and clicking Open.
-
Delete dashboard. You can delete one or more dashboards from the Manage Dashboards page. To delete a dashboard select the dashboard from the list under Manage Dashboards by clicking the check mark for each dashboard you want to delete (as shown below). Then click Delete. In the pop-up dialog, click OK to confirm deletion.

Creating a New Dashboard
You can create a new dashboard by clicking the + New Dashboard tab. A new tab opens.
In the dialog box, provide a name for the dashboard and an optional description.

A new blank dashboard opens in Edit mode. You can add any number of charts to the dashboard by searching for and selecting the chart from the Add Existing Chart drop-down menu. The drop-down lists all charts you have access to with at least view permission.

After you have finished adding all the charts you want to the dashboard, click Save. Your dashboard changes to view mode.
Editing a Dashboard
You can edit a dashboard by clicking Edit. From the Edit Dashboard panel you can perform multiple tasks.
Rename. Rename a dashboard by moving the cursor into the name field, and then clicking and editing the text.

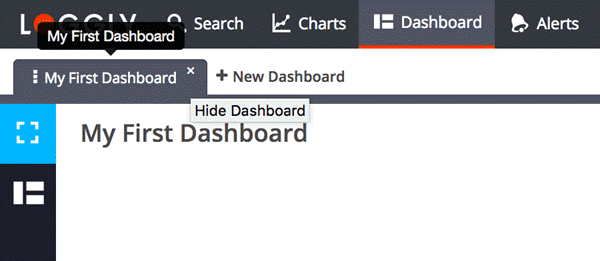
Hide. Hide the dashboard by clicking the X in the dashboard tab. View it again by selecting it from the Manage screen.
Setting Dashboard Permissions
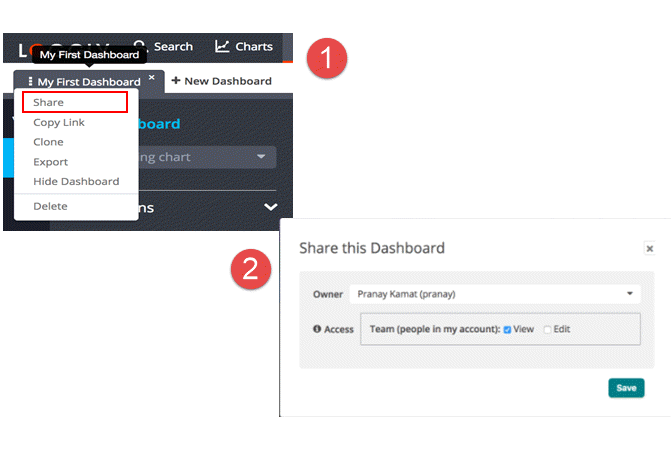
Dashboard permissions allow you to share and collaborate on a dashboard with other users in your account. Permissions are visible in the Edit Dashboard mode.
Owner. Indicates which user within your account owns the dashboard.
View. When the view check box is selected, anyone in your account can view the selected dashboard.
Edit. When the edit check box is selected, anyone in your account is permitted to make changes to the dashboard. Edit permission also allows users to change the owner of the dashboard. Edit is only permissible when View is selected.
Admins have Edit permission to all dashboards for all users in the account.
Dashboard Actions
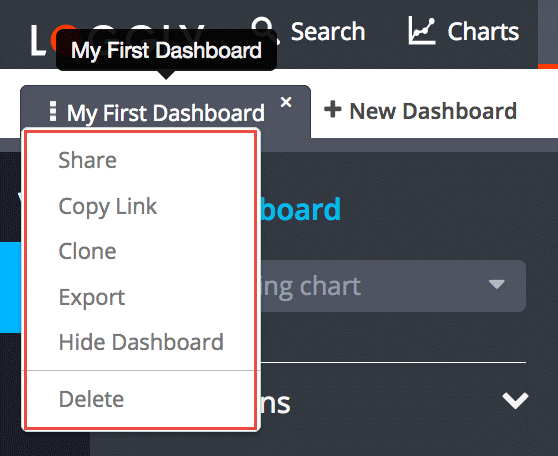
Clicking the Action icon (three vertical dots) on a dashboard tab allows you to view and perform the following actions:
-
Share. Opens the permission window where you can change owner and set view or edit permissions for the dashboard.
-
Copy Link. Copies the unique URL for the dashboard to the clipboard. It can then be pasted into an email or chat app to share with another user.
-
Clone. Creates a copy of the dashboard.
-
Export. Exports an image of the dashboard as a PNG file.
-
Hide Dashboard. Removes the dashboard tab from the Dashboard page. The dashboard remains accessible in Manage dashboards.
-
Delete. Deletes the dashboard. The dashboard will no longer be accessible in Manage dashboards.
Chart Actions
The individual charts within a dashboard also have an Action icon (three vertical dots). Clicking the Action icon in the upper right corner allows you to view and perform the following actions on any chart in the dashboard provided you have the required permissions.
-
Clone. Creates a new chart and opens the chart in the Charts page. The new chart’s name will be prefixed with Copy of followed by the name of the cloned chart.
-
Rename. Displays a window where you can enter the new name of the chart.
-
Copy chart link. Copies a unique permalink of the chart to the clipboard. You can share this link with other users who can click on the link to open the chart. Depending on the permissions for the chart, those users can view or edit the chart.
-
Share chart. Opens the Permissions window where you can change owner or set view and edit permissions.
-
Export. Exports an image of the chart as a PNG file
-
Remove chart. Removes the chart from the dashboard. The chart remains accessible in the charts Library.
-
Delete. Deletes the chart. The chart is no longer accessible in the Charts Library.
Chart refresh
You can choose the refresh interval for the charts in a dashboard. The two options are 5 minutes and 15 minutes. You can also choose to disable dashboard refresh.
After the refresh rate is selected, the Last Updated time stamp will be displayed.

Time range
You can use the time range drop-down menu at the top right corner of the dashboard to perform a one-click sync of the time ranges on all displayed charts on the dashboard.
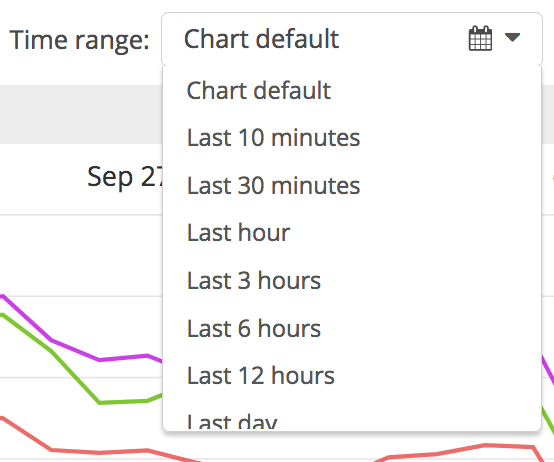
This setting does not persist and will be reset when you leave the page.
Legend
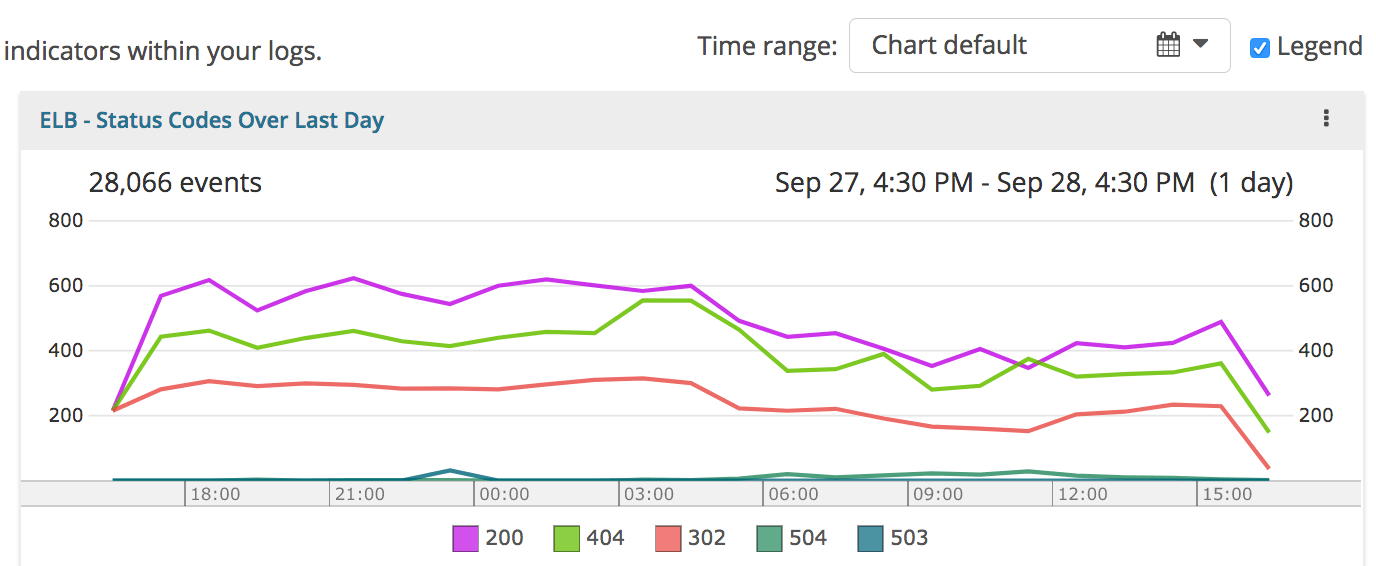
Check the box to show the Legend below the Charts as shown here.
If your chart has more than one series, the size of the chart will be reduced to make room for each series label.
