Monitor Your Loggly Data
Navigation Notice: When the APM Integrated Experience is enabled, Loggly shares a common navigation and enhanced feature set with other integrated experience products. How you navigate Loggly and access its features may vary from these instructions.
Once you've analyzed your log data and determined how to identify problems within your infrastructure, you should set up alerts, charts, and dashboards to monitor your logs for problems.
Create an Alert
Create an alert so that if responses come back slow in the future, you will receive a notification. With the search still active in the window:
- Click the Alert Bell to the right of the search fields.
- Enter a name for the alert with a Description in the fields provided.
-
Define the alert criteria. For example, the image below is configured to alert whenever there are more than 25 instances that occur within 5 minutes.
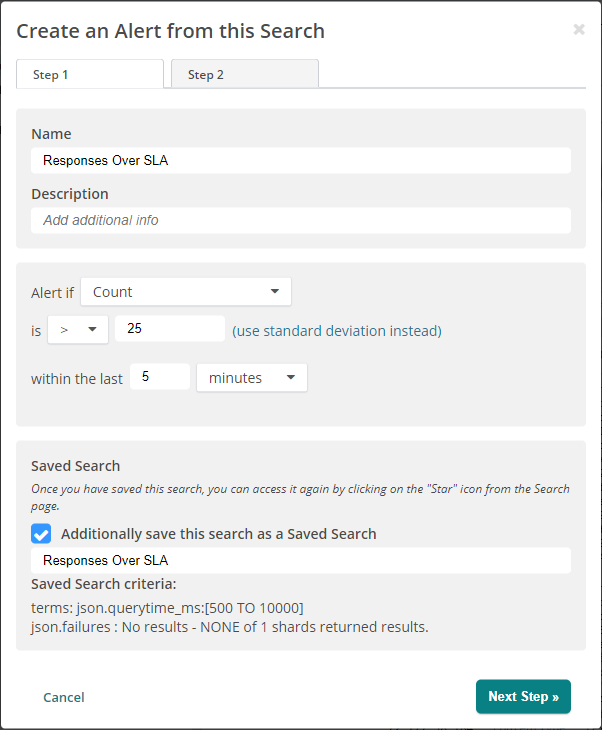
- Optionally select the Saved Search check-box and enter a name for the search.
-
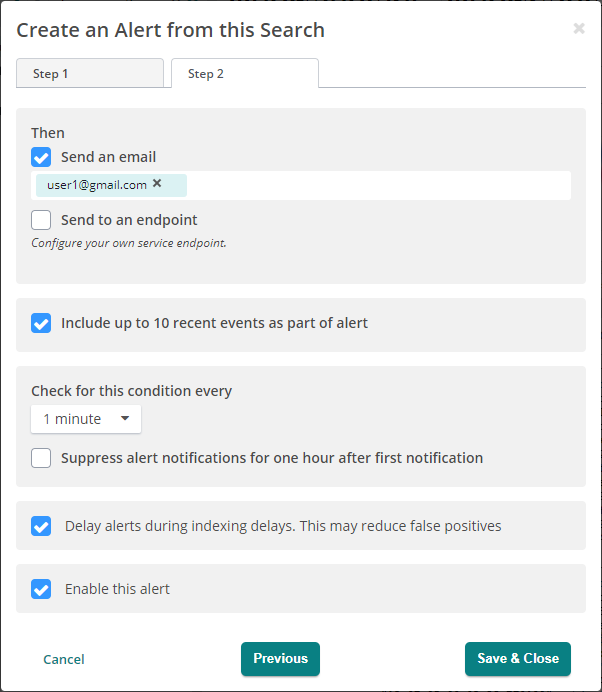
Click Next and choose to send this alert to an email or endpoint such as Microsoft Teams or Slack.
This alert won’t activate if you used Sample data because you are not sending live data and the saved search is on a custom time range rather than a relative one.
- Select the desired frequency to check for the condition.
-
Ensure the rest of the options match your alert needs and click Save & Close.
Save the Chart for Future Monitoring
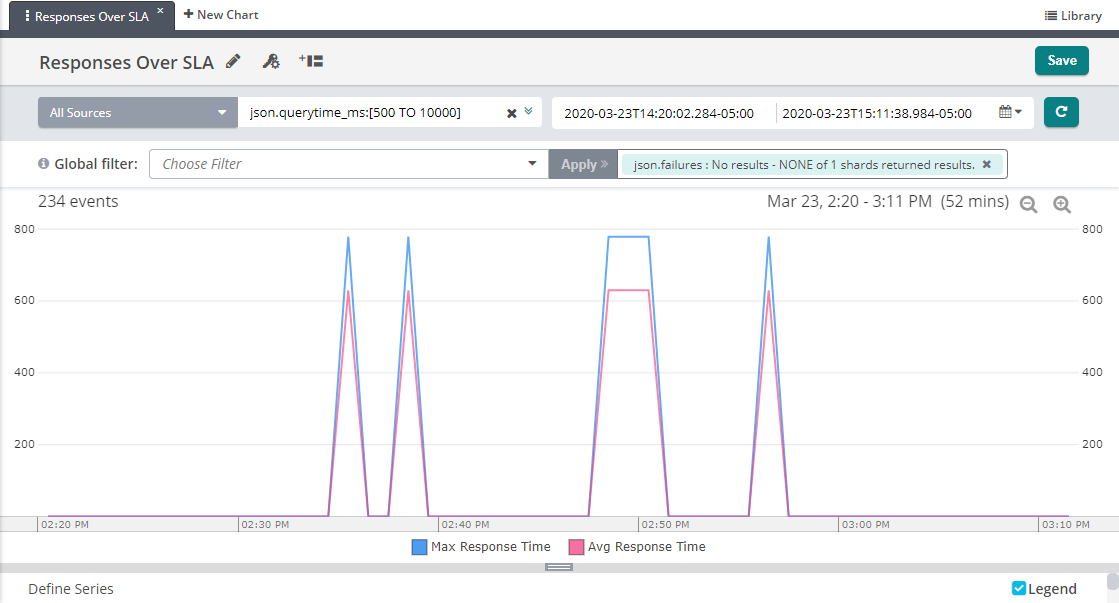
- Click the Edit chart button
 to open the chart in the Charts window.
 - Click the Edit chart name pencil in the chart name field, give the chart a new name, and click the green check mark.
- Click the Edit permissions for this chart button
 to change permissions for the chart.
 -
Click Save.
Create a Dashboard
- Click the Dashboard tab in the navigation pane.
- Click +New Dashboard.
- In the Edit Dashboard pane, select your previously created chart from the Add chart to dashboard drop-down and modify the permissions as desired.
-
In the dashboard pane, select the default name, Untitled Dashboard, and type a new name for the dashboard.
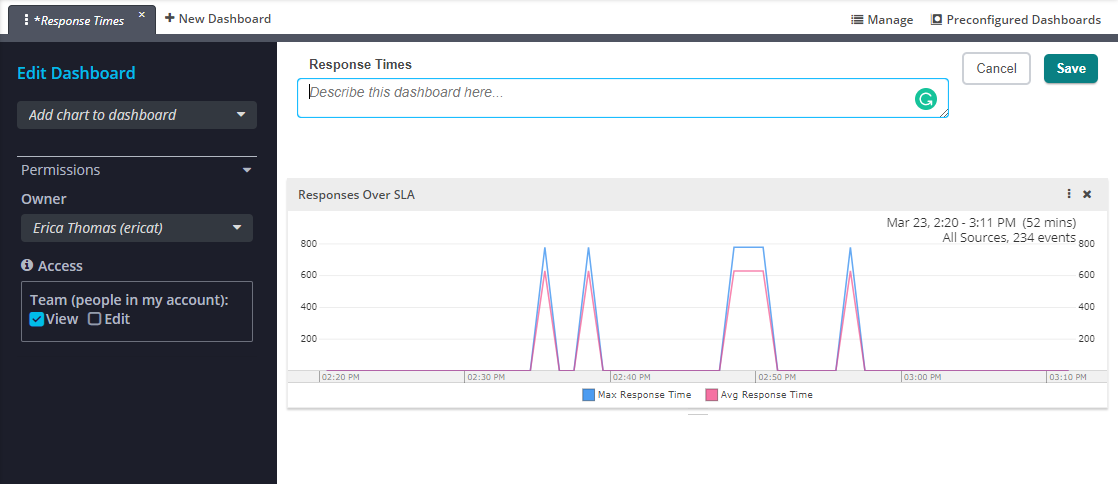
- Click Save.
-
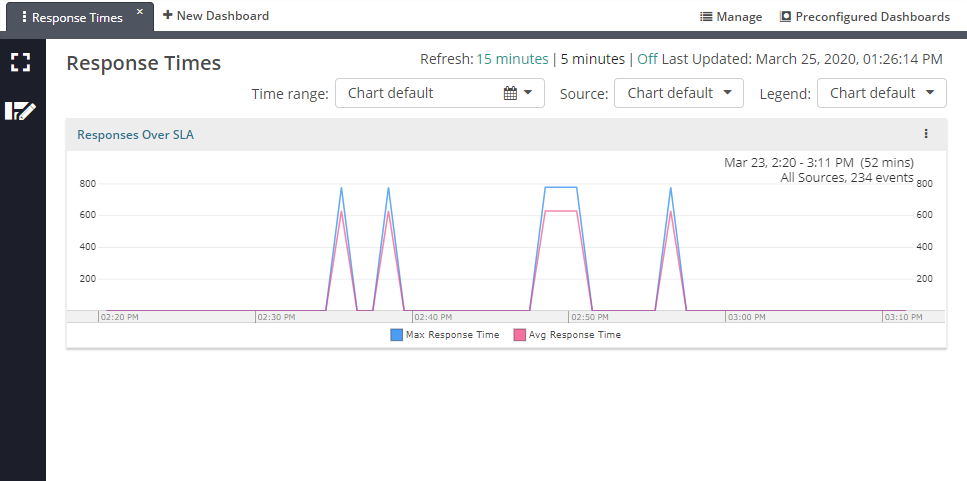
Click the 5 minutes link to refresh the chart data every five minutes.
Next Steps
You've now gone through the process of setting up and using Loggly under the most common scenarios. To find additional set-up instructions, learn about Loggly features, troubleshooting tips, and review API commands, refer to Loggly Administrator Guide.
