Automated Parsing Log Types
Navigation Notice: When the APM Integrated Experience is enabled, Loggly shares a common navigation and enhanced feature set with other integrated experience products. How you navigate Loggly and access its features may vary from these instructions.
Loggly automatically parses many types of data, including Apache, Nginx, JSON, and more. This allows you to use advanced features like statistical analysis on value fields, faceted search, filters, and more. Even if Loggly does not have automated parsing available for your log type, you can still log and perform full text searches over your logs. As you search through your data, you may notice that Loggly added a field called logType to your data. If Loggly couldn’t classify and break down your data into separate fields, all searches would be full text, preventing you from taking full advantage of Loggly search.
The different log types are provided below. You can see what kind of information each provides, what it is, what Loggly supports, and what to do if you send SolarWinds logs in a currently unsupported format.
Recognized Log Formats
Most generally recognized log formats have extensive documentation of their own. When appropriate, this documentation points you to those resources for in-depth information about a specific log format. The purpose here is to familiarize you with the way Loggly thinks about logs.
SolarWinds is constantly working to integrate more supported log types into the Loggly ecosystem. In fact, if you send SolarWinds a log format Loggly does not currently recognize, SolarWinds wants you to tell us about it.
Some log events may actually be classified as more than one log type. For example, if Apache logs are sent over syslog, they show up as logtype Apache and syslog. Below is a list of the classifications of log formats currently recognized.
- Apache
- Amazon Cloudfront
- Amazon ELB
- Custom
- HTTP Headers
- Java
- JSON
- Linux System
- MySQL
- Nginx
- Node JS
- PAM
- PHP
- Rails
- Syslog
- Windows
- Python
- MongoDB
- Heroku Logs
- HAProxy Logs
Apache

If you send Apache or nginx logs, Loggly extracts the following standard Apache log variables, as defined in the mod_log_config documentation:
%a - RemoteIPOrHost
%A - LocalIPOrHost
%b or %B - Size
%D - RequestUs (microseconds)
%h RemoteIPOrHost
%k - KeepAliveRequests
%l - RemoteLogname
%r - Request
%>s - HttpStatusCode
%t - eventTime
%T - ServiceTimeSeconds
%u - RemoteUser
%U - UrlPath
%v VirtualHost
%X - ConnectionStatus
%{Referer}i - Referer
%{User-agent}i - UserAgent
%{UNIQUE_ID}e - UniqueId
%{X-Forwarded-For}i - XForwardedFor
%{Host}i - Host
Loggly has a number of pre-canned formats that work, but because the Apache log format may be defined however you like, your particular format may not match any of these formats. The supported formats are:
%h %l %u %t %D "%r" %>s %b "%{Referer}i" "%{User-Agent}i"
%h %l %u %t "%r" %>s %b "%{Referer}i" "%{User-Agent}i"
%h %l %u %t "%r" %>s %b
%h %l %u %t "%r" %>s %b "%{Referer}i" "%{User-Agent}i" %v %h %T %A %>s %T
%h %l %u %t "%r" %b "%{Referer}i" "%{User-Agent}i" %v %h %T %A %>s %T
%h %l %u %t "%r" %>s %b "%{Referer}i" "%{User-Agent}i"
%h %l %u %t "%r" %>s %b "%{Referer}i" "%{User-Agent}i" %{UNIQUE_ID}e %D X-Forwarded-For=%{X-Forwarded-For}i Host=%{Host}i
%{Host}i/%v "%{X-Forwarded-For}i/%h" %t "%r" %>s %b %D %X %k "%{Referer}i" "%{User-Agent}i"
%v:%p %h %l %u %t "%r" %>s %D "%{Referer}i" "%{User-Agent}i"
%h %l %u %t "%r" %>s %D "%{Referer}i" "%{User-Agent}i"
%h %l %u %t "%r" %>s %D
Loggly also supports JSON logging from Apache. This might be a good option if you need a field that is not supported because you can log any fields in any order. Here is an example for the default Apache format in JSON.
LogFormat "{ \"time\":\"%t\", \"remoteIP\":\"%a\", \"host\":\"%V\", \"request\":\"%U\", \"query\":\"%q\", \"method\":\"%m\", \"status\":\"%>s\", \"userAgent\":\"%{User-agent}i\", \"referer\":\"%{Referer}i\" }"
Amazon CloudFront
Loggly automatically parses different types of AWS CloudFront logs. It extracts the standard CloudFront variables, as defined in the CloudFront Access logs documentation
Loggly parses the following types of Cloudfront logs.
Web Distribution Log File Format
date-time,x-edge-location,sc-bytes,c-ip,cs-method,cs(Host),cs-uri-stem,sc-status,cs(Referer),cs(User-Agent),cs-uri-query,cs(Cookie),x-edge-result-type,x-edge-request-id,x-host-header,cs-protocol,cs-bytes,time-taken,x-forwarded-for,ssl-protocol,ssl-cipher,x-edge-response-result-type

RMTP Distribution Log File Format
date-time,x-edge-location,c-ip,x-event,sc-bytes,x-cf-status,x-cf-client-id,cs-uri-stem,cs-uri-query,c-referrer,x-page-url,c-user-agent,x-sname,x-sname-query,x-file-ext,x-sid
Amazon ELB
Loggly automatically parses different types of AWS ELB Access logs. It extracts the standard ELB variables, as defined in the ELB Access logs documentation.
timestamp, elb_name, client_ip, client_port, backend_ip, backend_port, request_processing_time, backend_processing_time, response_processing_time, elb_status_code, backend_status_code, received_bytes, sent_bytes, request, user_agent, ssl_cipher, ssl_protocol

Custom Parsing
There are many existing tools to translate custom log formats into JSON and then send them to Loggly. Here are instructions for popular tools:
- Fluentd which includes a variety of parsers and filters
- Rsyslog property replacer and field extraction
- Syslog-NG use patterndb to parse log messages
HTTP Headers
Loggly automatically parses out the HTTP headers from the HTTP request. They can be viewed as the HTTP fields in the field explorer. Here is an example of an HTTP request. Loggly parses out the headers content-type (as contentType) and X-Forwarded-For (as clientHost) from the following request.
curl -H "content-type:text/plain" -H "X-Forwarded-For:203.156.135.1" -d "Hello4" https://logs-01.loggly.com/inputs/TOKEN/tag/http/
Here is how it looks in Loggly’s expanded events view.

Java
Log4j
Loggly automatically parses Java logs that follow this conversion pattern layout in Log4j. It extracts the timestamp, method, fully classified class name, thread, and log level. Loggly provides instructions on how to configure Log4j with Loggly. Field definitions can be found in Log4j documentation. The first field in the conversion pattern is the syslog appname, in this case it’s set to java. If you are using an HTTP appender, you do not need to add an appname.
%d{"ISO8601"}{GMT} %p %t %c %M - %m%n
Logback
Loggly also automatically parses Java logs that follow this conversion pattern layout. It extracts the timestamp, method, fully classified class name, thread, and log level. Loggly provides instructions on how to configure Logback with Loggly. Field definitions can be found in Logback documentation.
%d{"ISO8601", UTC} %p %t %c %M - %m%n
Here is an example of what the Java logtype looks like in Loggly’s expanded event view. You can see each of the Java fields as well as the unparsed message.

Loggly automatically parses Java Logback exceptions and shows message and stacktrace in individual fields.
Servlets
Loggly can parse Log4J logs from a servlet using the following format:
<Timestamp> <Log4J Priority> <Category> - <msg_id> <status> <responseTimeMs>
Example:
23:51:49 INFO com.cx.Core2Common.servlet.PostLogHandler - 6oA4sQHUQYiAOLEB1KGIEg: RESPONSE 200 661
Java stack trace
Loggly can extract class name and file line number for a partial java stack trace. Loggly also supports multi-line stack traces through its syslog collectors if they are sent in a single event. However, the default SyslogAppender splits them into multiple events so you’d need to override it and send them in a single event.
Example:
at org.springframework.aop.framework.Cglib2AopProxy$DynamicAdvisedInterceptor.intercept(Cglib2AopProxy.java:621)
Java garbage collector
Loggly parses out the heap size and other statistics from java garbage collector logs. You can read more in How-to: Analyzing JVM garbage collection using Loggly.
Here is an example log line:
2014-05-21 22:51:07.967 UTC 2014-05-21T22:51:07.967+0000: 763119.351: [GC [PSYoungGen: 1383698K->8412K(1387072K)] 2422839K->1047651K(4183296K), 0.0237820 secs] [Times: user=0.14 sys=0.00, real=0.02 secs]
Here is what it looks like in Loggly’s expanded events view. The syslog header is included only if you send over syslog.

JSON
SolarWinds *strongly* recommends sending your data in JSON format. It gives you the highest precision of event parsing, which in turn gives you access to all of the cool features provided in the Loggly analytics toolset.
If you send JSON, Loggly extracts it provided it is valid JSON and it’s the final part of the message you send. This means you can send serialized JSON using your normal logging frameworks, and Loggly will find the JSON no matter what precedes it in the event. For example, if you use log4j, your standard log4j headers precede the JSON in your logged message, but Loggly can still extract the JSON. If you’re logging JSON directly to Loggly, then it is (by definition) the final part of the message you send, as required.
To ensure that your JSON is valid, SolarWinds recommends running a few of your events through a JSON validation tool, for example, JSON Lint.
JSON Timestamp Support
In order for Loggly to recognize the timestamp you send in with the event, follow these guidelines:
- The only timestamp format accepted is ISO 8601 (e.g., 2013-10-11T22:14:15.003Z).
- Loggly supports microseconds/seconds fraction up to 6 digits, per the spec in RFC5424.
- Must be a top level JSON field called either: Timestamp, timestamp, or eventTime.
Here’s an example of a top-level JSON field, called timestamp. It is not a child of another object, and it has no children:
{
  "timestamp": "2013-10-11T22:14:15.003123Z",
  "travel": {
    "airplane": "jumbo",
    "mileage": 2034
  }
}
JSON Schema
Be aware that even JSON needs to follow a schema when it is indexed. For example, if an object includes a field that is typed as an integer, it can’t be retyped. Here’s an example of an object called travel:
{
  "travel": {
    "airplane": "jumbo",
    "mileage": 2034
  }
}
By retyping travel as a string, shown below, the field is not indexed.
{
 "travel": "none"
}
JSON Field Names
Loggly indexes the JSON you send exactly as you send it with one exception. Names that contain spaces or dots are rewritten with those characters replaced by underscores.
This change is required because the Loggly search infrastructure does not support either of these characters in field names.
An example:
{
  "a": 1,
  "b c": 2,
  "d.e": 3,
  "f": {
    "g.h": "4,
    "g": {
      "h": 5
    }
  }
}
would be rewritten to:
{
  "a": 1,
  "b_c": 2,
  "d_e": 3,
  "f":{
    "g_h": 4,
    "g": {
      "h": 5
    }
  }
}
One of the main reasons Loggly does this is to ensure that dot-notation navigation is unambiguous. In the example above, because the name g.h was changed to g_h, Loggly can unambiguously distinguish between f.g_h and f.g.h.
A search for JSON data will look like this:
json.f.h:5
Linux System
Loggly parses some system commands (example: cron jobs) and extracts the command string, user, and command executable name.
Here is an example log line:
2014-05-21 23:02:01.000 UTC (jon) CMD (/home/jon/sarmon.sh > /dev/null 2>&1)
Here is how it looks in Loggly’s expanded events view. The syslog header is only included if you send events over syslog.

MySQL
Loggly supports automated parsing for MySQL logs. It parses out the rowsExamined, lockTime, rowsSent, and queryTime from MySQL logs sent via syslog.
Here is how it looks in Loggly’s expanded events view. The syslog header is also included.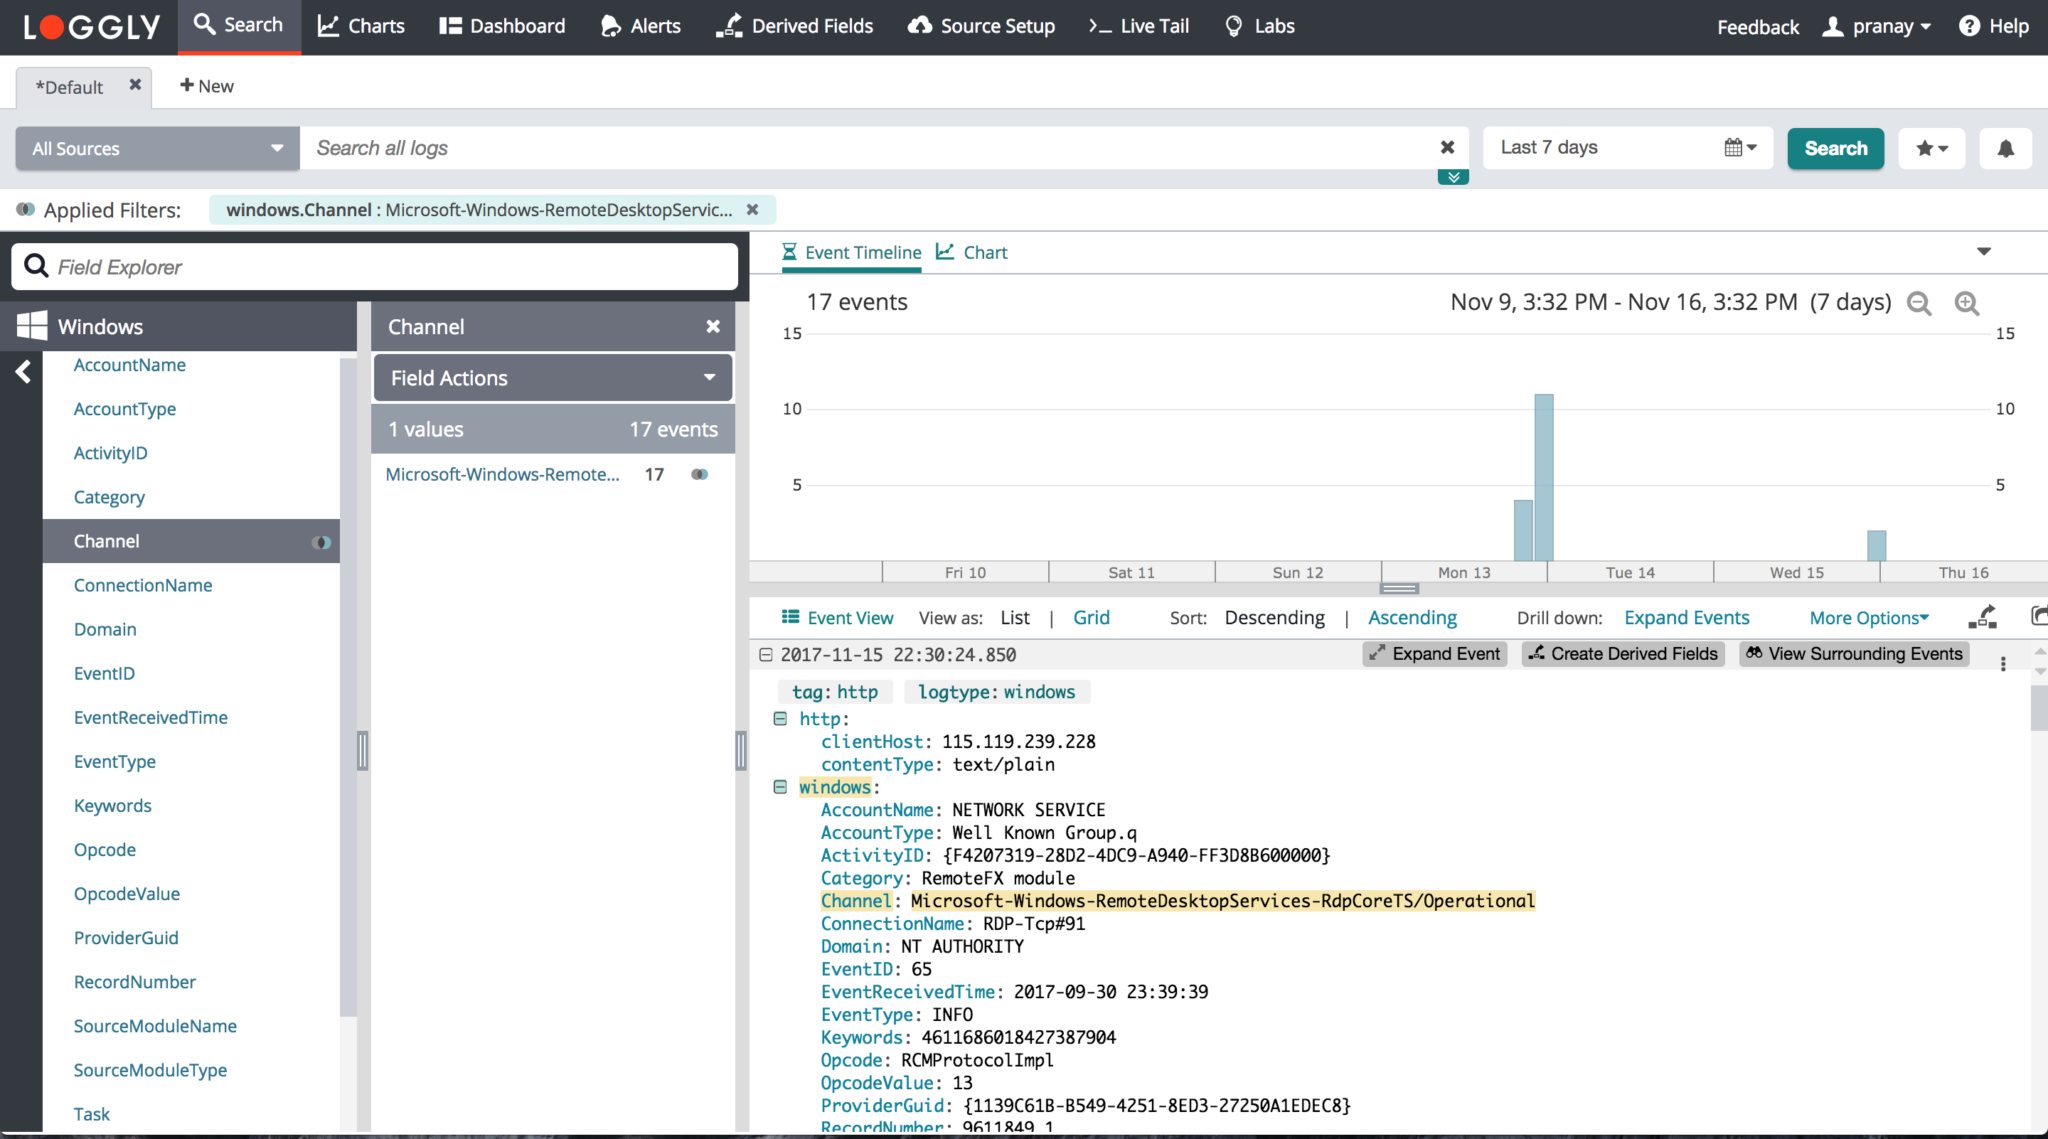
Nginx
Loggly works out of the box with the standard Nginx format without compression. Make sure the appname contains the nginx word, otherwise it may get incorrectly recognized as other logtype.
            log_format nginx '$remote_addr - $remote_user [$time_local] '
      '"$request" $status $bytes_sent '
      '"$http_referer" "$http_user_agent"';
access_log /spool/logs/nginx-access.log nginx buffer=32k;
For custom formats, Nginx has a log format similar to Apache but there are some differences. In particular, Nginx uses words instead of letters in the configuration, and the request time is in microseconds in Apache and milliseconds in Nginx. If you don’t see a format you need here, you can also send JSON (see Apache for an example).
Currently supported Nginx custom formats are:
'$remote_addr - $remote_user [$time_local] "$request" $status $bytes_sent "$http_referer" "$http_user_agent"';

'$remote_addr - $remote_user [$time_local] "$request" $status $bytes_sent';

'$remote_addr - $remote_user [$time_local] "$request" $status $body_bytes_sent "$http_referer" "$http_user_agent" - $request_time X-Forwarded-For=$http_x_forwarded_for Host=$host';

'$remote_addr - $remote_user [$time_local] $request_time "$request" $status $bytes_sent "$http_referer" "$http_user_agent"';

'$remote_addr - $remote_user [$time_local] "$request" $status $body_bytes_sent "$http_referer" "$http_user_agent" "$http_x_forwarded_for"'

'$remote_addr - $remote_user [$time_local] "$request" $status $body_bytes_sent "$http_referer" "$http_user_agent" - $request_time X-Forwarded-For=$http_x_forwarded_for Host=$host $request_id';
Here's an output example.

Node JS
Loggly automatically parses Node JS data, including exceptions and other JSON fields.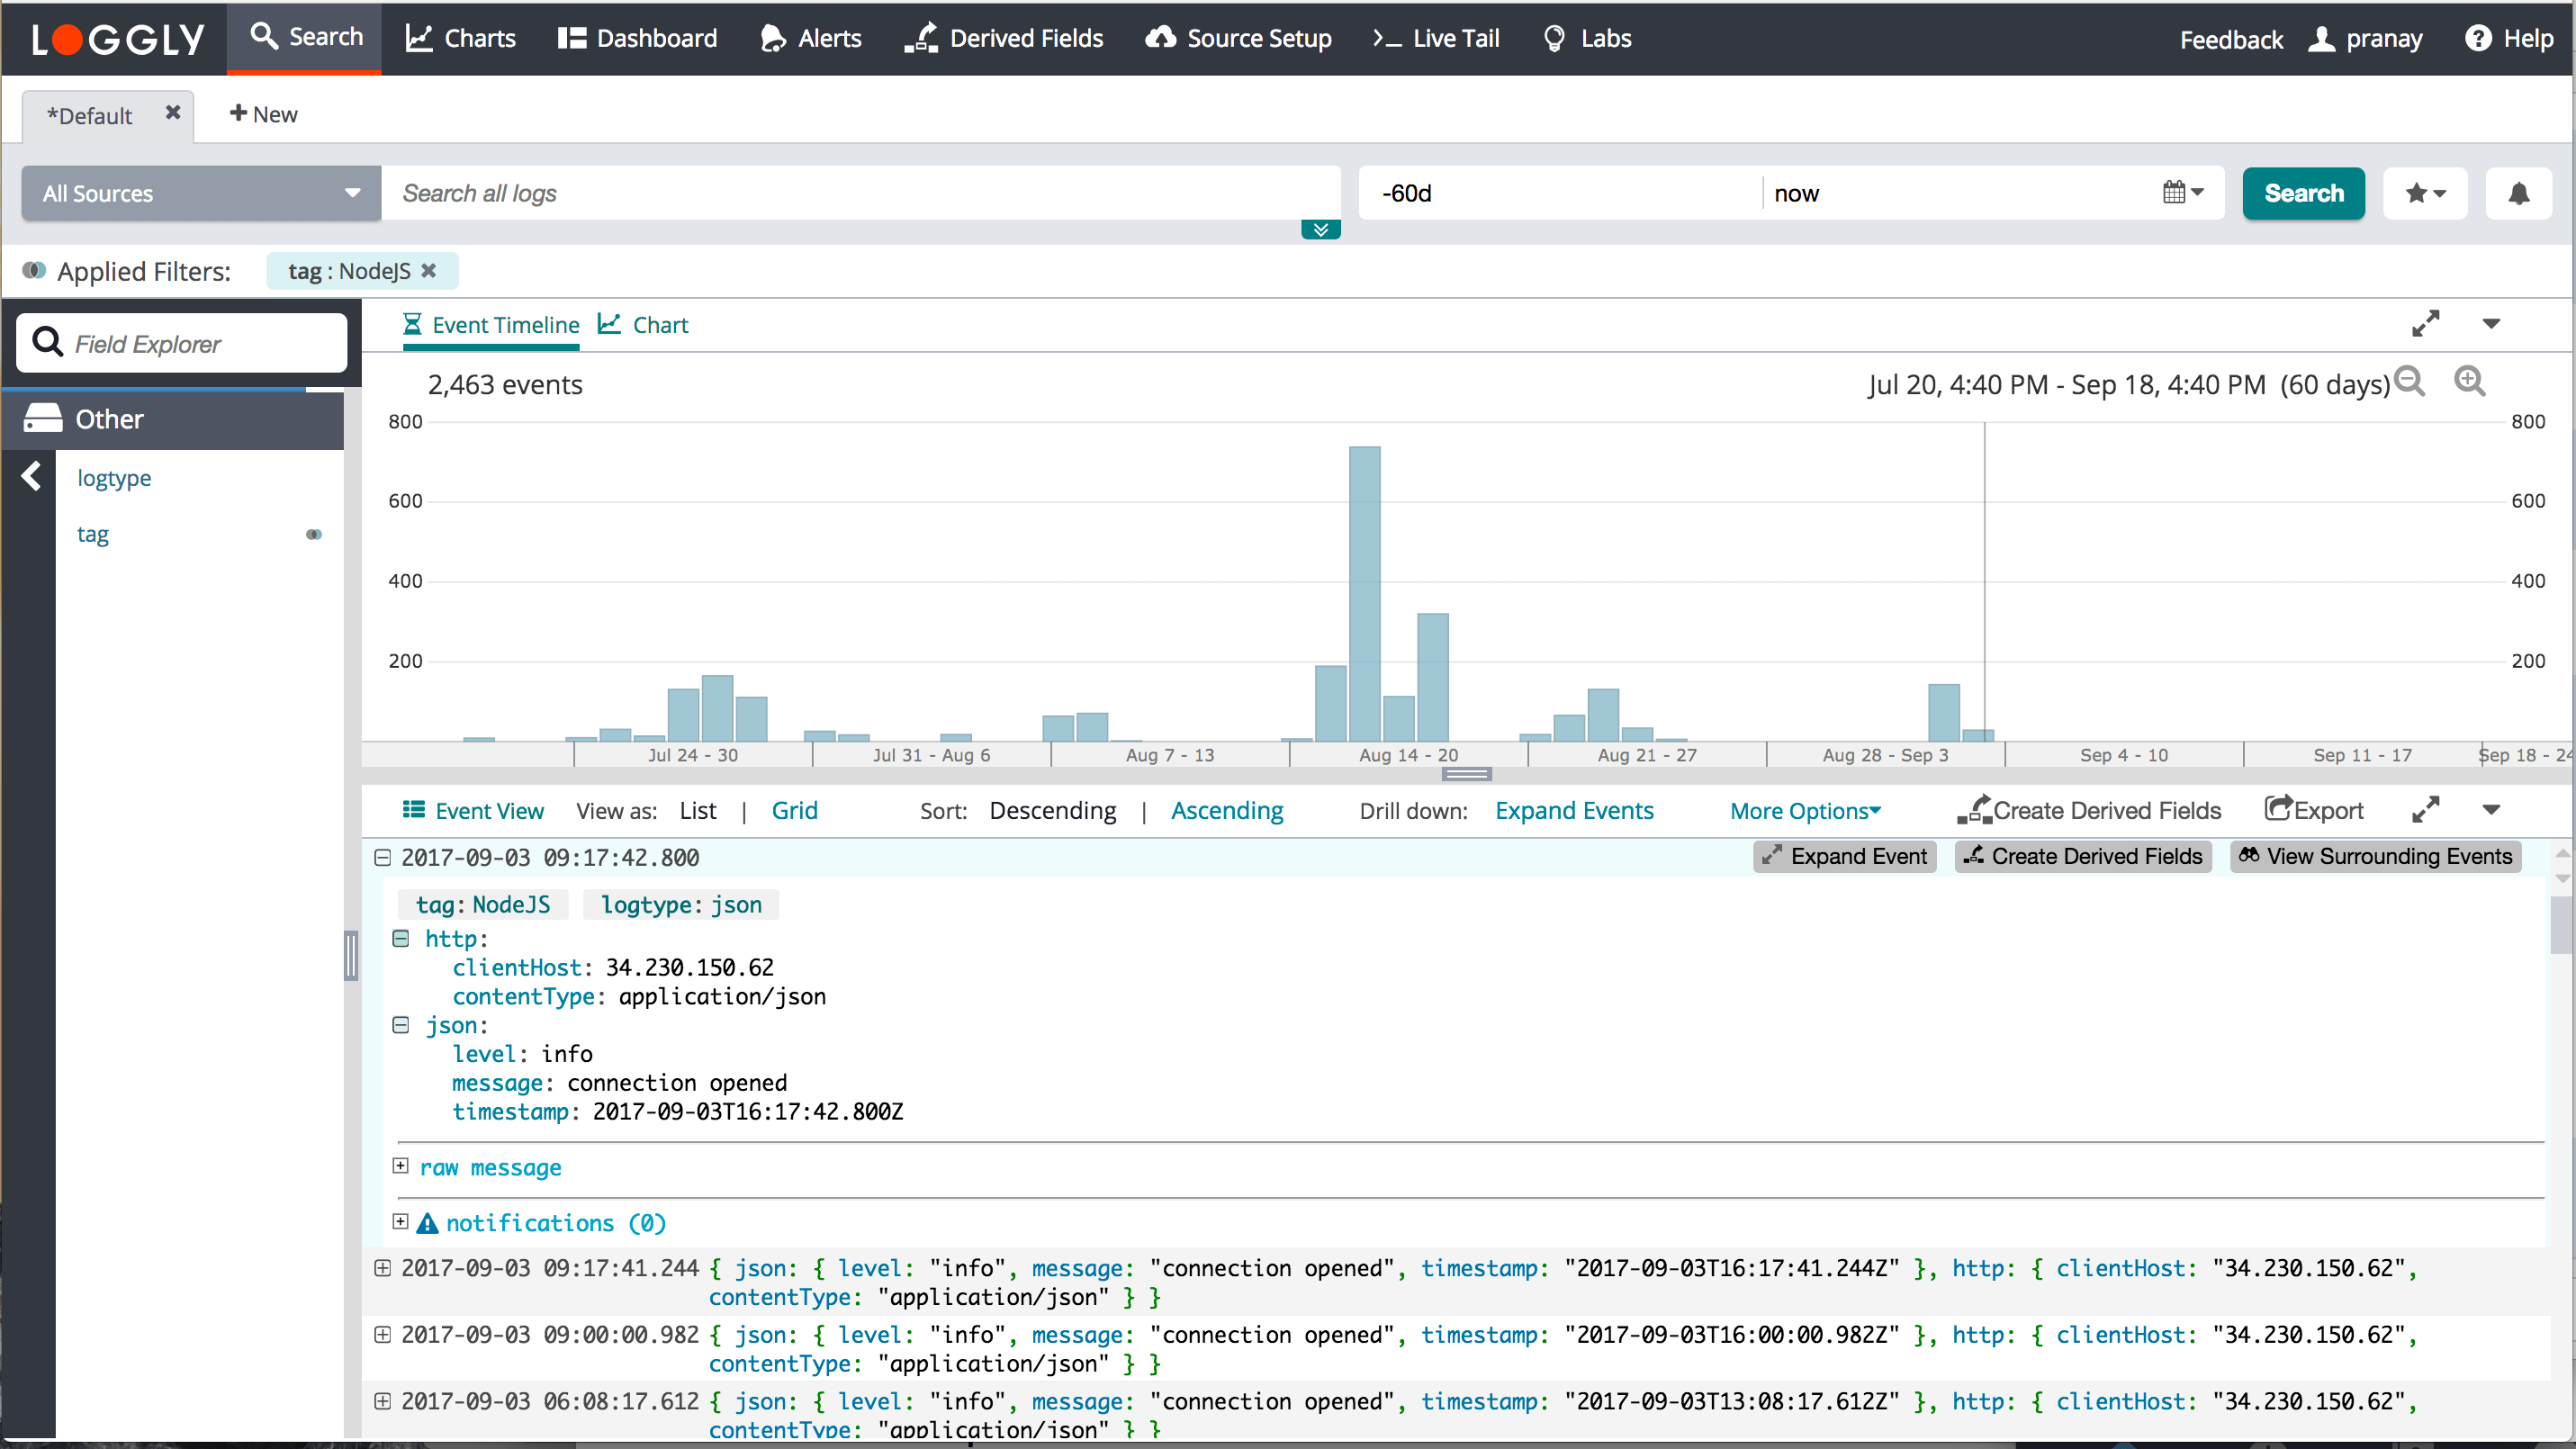
PAM
Loggly supports automated parsing for PAM logs. It parses out the timestamp, host name, application name, user, and section action from PAM logs sent via syslog. Here is an example log line from PAM:
pam_unix(cron:session): session opened for user ubuntu by (uid=0)
PHP
Loggly supports automated parsing for PHP logs. It parses out the method, level, timestamp, and message from PHP logs sent via syslog. Here is how it looks in Loggly’s expanded events view. The syslog header is also included.

Loggly also automatically parses PHP exceptions and extract exception messages and stacktraces.
Rails
Loggly parses out the process, output format, and method from Rails logs sent via syslog.
It also automatically parses Rails exception logs and shows backtrace in a specific field.
Syslog

If you use syslog, SolarWinds can guarantee that your syslog headers and structured data will be extracted, independent of the actual message contents, provided you use the Loggly standard syslog configuration. These configs are based on the Syslog Protocol RFC5424, and Loggly extracts the following fields (using RFC names):
PRIVAL, Facility, Severity, VERSION, TIMESTAMP, HOSTNAME, APP-NAME, PROCID, MSGID
Loggly's standard config also allows you to define tags in the STRUCTURED-DATA part of the message. As an example, if your structured data looks like this:
[01234567-89ab-cdef-0123-456789abcdef@41058 tag="foo" tag=bah]
Loggly extracts foo and bah as tags, which you can then use to refine searches. For example, you could use tag:foo, which you could also use in the Charts tab.
Windows
Loggly can auto parse the fields for the Windows Event Log. SolarWinds has added support for the native key-value pair format that nxlog creates when it sends Windows logs.
For example, consider this event:
<13>1 2017-10-25T20:24:47.651000+01:00 i-0928d5725cbe8c59a IIS - - [45043289-61f2-4a42-bf27-d366041b1668@41058 tag="windows" tag="ami-2662935f" tag="HostingWebserverMaster"] [ EventReceivedTime="2017-10-25 20:24:48" SourceModuleName="iis_advanced" SourceModuleType="im_file" Date="2017-10-25" Time="19:24:47.651" ServerIp="10.37.0.132" Host="stdunstans.fireflycloud.net" Url="/Templates/pixel.gif" Path="C:IIS Sitesstdunstans.fireflycloud.netwwwTemplatespixel.gif" Status="200" TimeTakenInMS="0" UserAgent="Mozilla/5.0 (Windows NT 10.0; Win64; x64) AppleWebKit/537.36 (KHTML, like Gecko) Chrome/52.0.2743.116 Safari/537.36 Edge/15.15063" ClientIP="90.194.93.48" Referer="https://stdunstans.fireflycloud.net/set-tasks/8943" ELBIP="10.81.168.76" Win32Status="0" Method="HEAD"] {"EventReceivedTime":"2017-10-25 20:24:48","SourceModuleName":"iis_advanced","SourceModuleType":"im_file","Date":"2017-10-25","Time":"19:24:47.651","ServerIp":"10.37.0.132","Host":"stdunstans.fireflycloud.net","Url":"/Templates/pixel.gif","Query":null,"Path":"C:IIS Sitesstdunstans.fireflycloud.netwwwTemplatespixel.gif","Status":200,"TimeTakenInMS":0,"UserAgent":"Mozilla/5.0 (Windows NT 10.0; Win64; x64) AppleWebKit/537.36 (KHTML, like Gecko) Chrome/52.0.2743.116 Safari/537.36 Edge/15.15063","ClientIP":"90.194.93.48","Referer":"https://stdunstans.fireflycloud.net/set-tasks/8943","ELBIP":"10.81.168.76","Win32Status":0,"Method":"HEAD","EventTime":"2017-10-25 20:24:47","SourceName":"IIS"}
This is what a Parsed Event looks like:
"windows":{
  "Path":"C:IIS Sitesstdunstans.fireflycloud.netwwwTemplatespixel.gif",
  "Status":"200",
  "SourceModuleType":"im_file",
  "TimeTakenInMS":"0",
  "ServerIp":"10.37.0.132",
  "Referer":"https://stdunstans.fireflycloud.net/set-tasks/8943",
  "Time":"19:24:47.651",
  "Host":"stdunstans.fireflycloud.net",
  "Win32Status":"0",
  "Method":"HEAD",
  "ClientIP":"90.194.93.48",
  "ELBIP":"10.81.168.76",
  "EventReceivedTime":"2017-10-25 20:24:48",
  "Date":"2017-10-25",
  "Url":"/Templates/pixel.gif",
  "SourceModuleName":"iis_advanced",
  "UserAgent":"Mozilla/5.0 (Windows NT 10.0; Win64; x64) AppleWebKit/537.36 (KHTML, like Gecko) Chrome/52.0.2743.116 Safari/537.36 Edge/15.15063"
}
Python
Loggly automatically parses the fields when you send Python logs. It extracts the errorType, exceptionMessage, message, and stacktrace. Consider the following example:
list index out of range

Traceback (most recent call last):

File "/root/jatin/harshil/views.py", line 28, in index

A[5]

IndexError: list index out of range
 Booking exception: City: Bora Bora, French Polynesia Hotel: Le Meridien

Traceback (most recent call last):

File "/root/jatin/harshil/views.py", line 16, in index

raise KeyError

KeyError
The first example is parsed as:
- message > list index out of range
- stacktrace > File "/root/jatin/harshil/views.py", line 28, in index#012 a5
- errorType > IndexError
- exceptionMessage > list index out of range
The second example is parsed as:
- message > Booking exception: City: Bora Bora, French Polynesia Hotel: Le Meridien
- stacktrace > File "/root/jatin/harshil/views.py", line 16, in index#012 raise KeyError
- errorType > KeyError
- exceptionMessage > N/A

MongoDB 3.x
Loggly automatically parses the fields for MongoDB 3.x. It extracts the timestamp, severity, component, module, command, commandDetails, and severity. Consider the following example:
2017-09-13T09:52:43.207+0000 I COMMAND [conn21] command test.$cmd command: delete { delete: "customers", deletes: [ { q: { first_name: "test8" }, limit: 0.0 } ], ordered: true } keyUpdates:0 writeConflicts:0 numYields:0 reslen:25 locks:{ Global: { acquireCount: { r: 1, w: 1 } }, Database: { acquireCount: { w: 1 } }, Collection: { acquireCount: { w: 1 } } } protocol:op_command 0ms

2017-09-27T11:41:13.299+0530 I NETWORK [initandlisten] waiting for connections on port 27017
Under the current rules, the above examples match the following:
- timestamp -> 2017-09-13T09:52:43.207+0000, severity -> I, component -> COMMAND, module -> conn21, __command -> delete, commandDetails -> { delete: "customers", deletes: [ { q: { first_name: "test8" }, limit: 0.0 } ], ordered: true } keyUpdates:0 writeConflicts:0 numYields:0 reslen:25 locks:{ Global: { acquireCount: { r: 1, w: 1 } }, Database: { acquireCount: { w: 1 }\ }, Collection: { acquireCount: { w: 1 } } }
- timestamp -> 2017-09-27T11:41:13.299+0530, severity -> I, component -> NETWORK, module -> initandlisten
Heroku
Loggly supports Heroku events through an HTTP drain. Matches occur when the syslog.appName field is equal to heroku.
- If the
syslog.procIdfield is router then it is identified as a router event and the key-value pairs are extracted (see example below). - If the
syslog.procIdfield is a dyno name then the event is seen as a heroku log type.350 <158>1 2017-09-27T23:37:27.018826+00:00 host heroku router - at=info method=GET path="/assets/analytics/home-analytics-36cbb0bbd4caddefda4ac54f186b083d3e4e732e1a6d4d35ff42dd26fbacab86.js" host=www.bookwitty.com request_id=9b5368cd-0909-4da8-8bec-a055fd48fd97 fwd="90.214.230.12" dyno=web.1 connect=1ms service=3ms status=200 bytes=585 protocol=https 101 <45>1 2017-09-27T23:37:27.018826+00:00 host app web.1 - Stopping remaining processes with SIGKILL
Router Example
- logtype > syslog, heroku
- syslog.appName > heroku
- syslog.procid > router
- heroku
- dyno > router
- source > heroku
- heroku fields > Key/value pairs are extracted from the example above
Generic Example
- logtype > syslog, heroku
- syslog.appName > app
- syslog.procId > web.1
- heroku
- dyno > web.1
- source > app

HAProxy Logs
Loggly automatically parses the fields for HAProxy Logs. Here are some HAProxy example logs that are autoparsed.
<134>0 2017-11-08T18:49:20+00:00 haproxy-aws-prod-2 haproxy 14 - [4d84319c-fd36-4bc5-97a6-bba81c43d566@41058 tag="lw-prod-env"] 172.31.5.1:22923 [08/Nov/2017:18:49:20.145] port_443~ SERVICE_REDHATSSO_AWS_PROD/REDHATSSO_AWS_PROD_2 1/0/1/9/11 200 724 - - ---- 475/466/51/18/0 0/0 "GET /auth/admin/realms/CPM/users/8263e890-0586-423d-a335-2c7eaaae86a6 HTTP/1.1" <134>0 2017-11-05T20:03:37.573414+00:00 prod-sync-3-19-0-1509330995-i-0b88cef16f2be02c5 haproxy 638906 - [45c30368-1466-4ef9-94ce-13e8b15e22bf@41058 tag="RsyslogTLS"] 172.26.33.104:46286 [05/Nov/2017:20:03:37.572] ft_frm_ws_sync bk_frm_ws_sync/websrv2i05e4ad9c76e1415c5 0/0/0/1/1 200 250 - - --VN 1113/1113/1108/26/0 0/0 "GET /socket.io/?EIO=3×tamp=1509911907386&uid=sGLQWJJR&sid=B8A_3NCaA27w48HRAlmI&frameId=58f2701a3a459c35&count=29&transport=polling&reason=SafetyTimer&rebootCount=7&timedOut=false&signature=XB3866waDCDZsA9FO4BCApdCOAAWobgiV12P6OovCvk%3D HTTP/1.1" <150>0 2017-11-08T18:37:03+00:00 52.25.18.219 haproxy 3061 - [f04d1741-de66-4345-8cce-5d461d954a6d@41058 tag="RsyslogTLS" tag="atom-web-lb"] 174.49.81.34:34255 [08/Nov/2017:18:37:03.029] main~ regal/elb 133/0/3/178/422 200 17503 - - ---- 397/397/2/2/0 0/0 "GET /theaters/regal-dawson-10-cinemas/C0042052406 HTTP/1.1"

Unsupported log types
If you’d like to request a log type, contact SolarWinds.
The scripts are not supported under any SolarWinds support program or service. The scripts are provided AS IS without warranty of any kind. SolarWinds further disclaims all warranties including, without limitation, any implied warranties of merchantability or of fitness for a particular purpose. The risk arising out of the use or performance of the scripts and documentation stays with you. In no event shall SolarWinds or anyone else involved in the creation, production, or delivery of the scripts be liable for any damages whatsoever (including, without limitation, damages for loss of business profits, business interruption, loss of business information, or other pecuniary loss) arising out of the use of or inability to use the scripts or documentation.