Correlate configuration changes to performance metrics in SCM
In Server Configuration Monitor (SCM), you can see how a change in server configurations may have affected the server's performance by viewing changes on a timeline with performance metrics using the Performance Analysis Dashboard (PerfStack™).
- Navigate to the Node Details Summary page for the node you want to examine.
- In the Management widget, click Performance Analyzer.
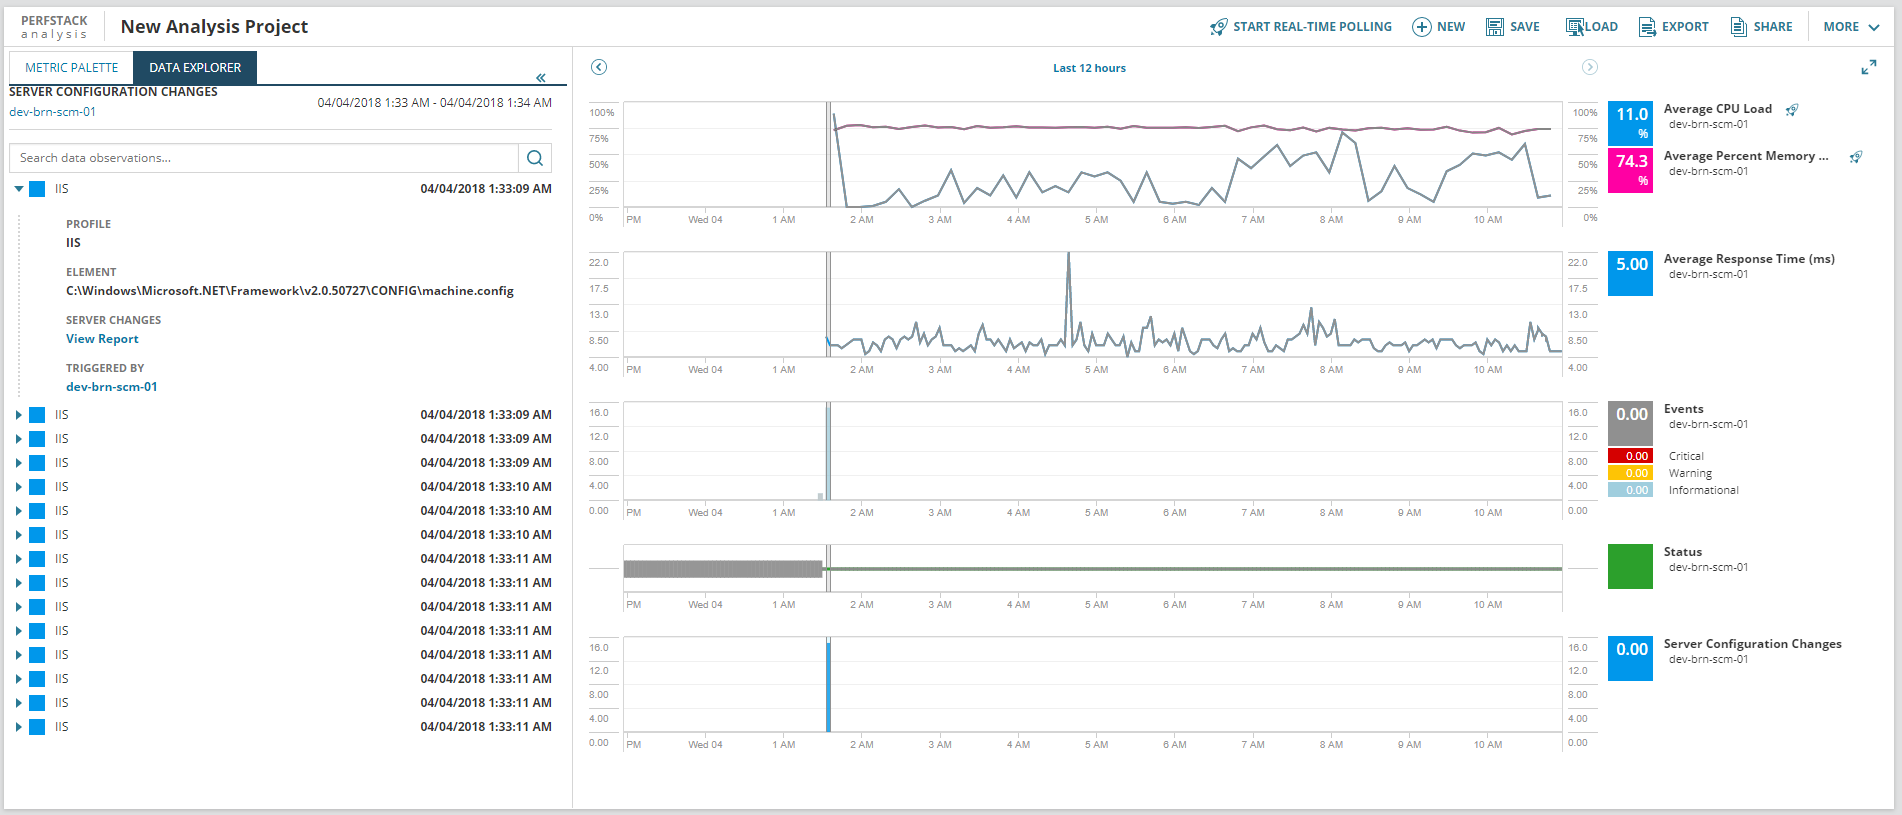
Configuration changes will be shown at the bottom in blue. The X-axis shows time, and the Y-axis of the SCM portion shows how many changes were made. To view configuration change details, hover over a column of changes and click the Inspect selection in the data explorer icon. Change details are displayed in the Data Explorer to the left.

You can also manually add Server Configuration Changes to any custom PerfStack view.
- Select a node in the Metrics Palette.
- Find Server Configuration Changes under Status, Events, Alerts.
- Drag and drop Server Configuration Changes into the PerfStack view.
