Response time and calculations in the uptime report
For an uptime check (http check) the response time is calculated as the time it takes to perform an HTTP GET to the specified URL, so the response time is calculated in three parts:
- Time to first byte
- Time to receive headers
- Time to load HTML of the site
Skipping dynamic content, most of you will recognize this as basically a cURL request. If you want a response time that is just TTFB (time to first byte) you can use a Ping check as this is almost equivalent.
And of course, if you want to get more performance data, use our Page Speed Check.
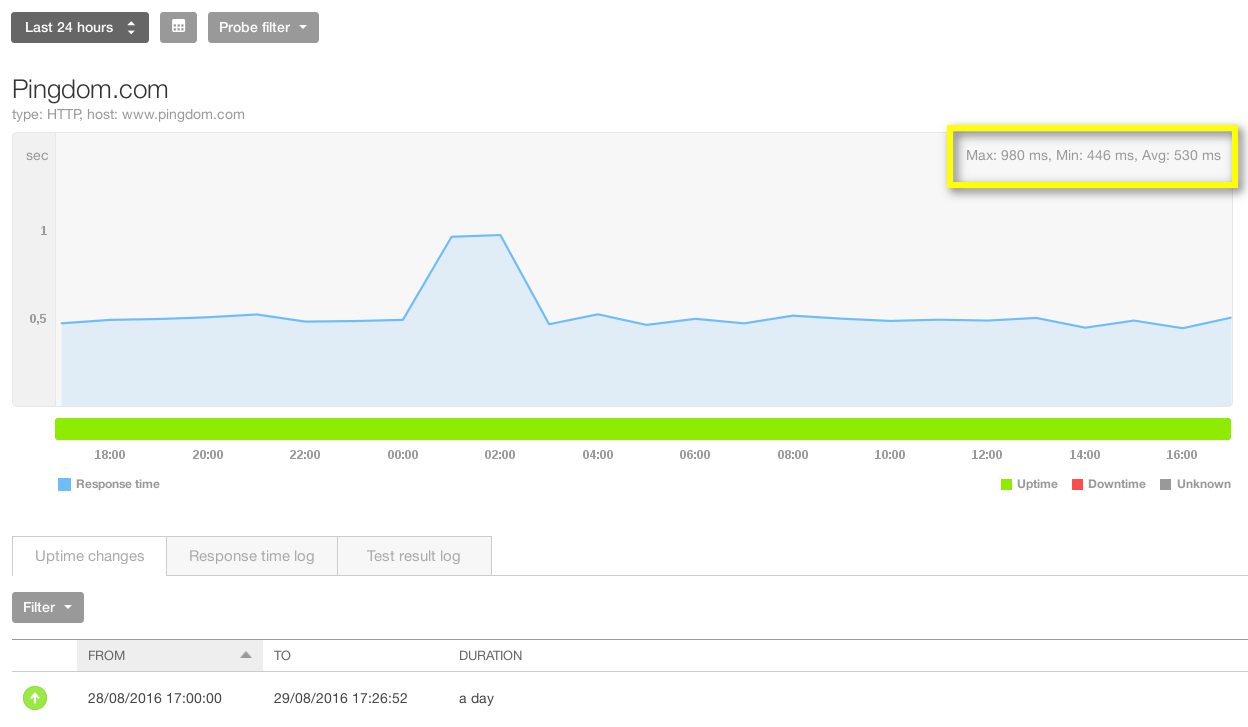
Now to explain how the uptime report shows the Max Min and Average display up in the righthand corner of the graph.
If the timespan of the report is 3 days or shorter, then a hourly average is used for the data points in the graph and report for your Uptime check, if the timespan is longer then a 24 hour average is used for each data point.
This means that each data point in the graph with a 3 day time span, for a check with a 1 minute test interval, is represented by an average of 60 tests, and if the time span is increased the sampling for each data point is 1440 tests. This has the effect that the maximum and minimum are of a lesser magnitude as extremes are lost when an average is calculated and more data points are sampled.
You can get all the data points you want using our API, with the path /api/2.0/summary.performance/{checkid}, the documentation can be found here.
Navigation Notice: When the APM Integrated Experience is enabled, Pingdom shares a common navigation and enhanced feature set with other integrated experience products. How you navigate Pingdom and access its features may vary from these instructions.
