Google Analytics and Pingdom
Pingdom has different services and the behavior in triggering various analytics on your site will differ.
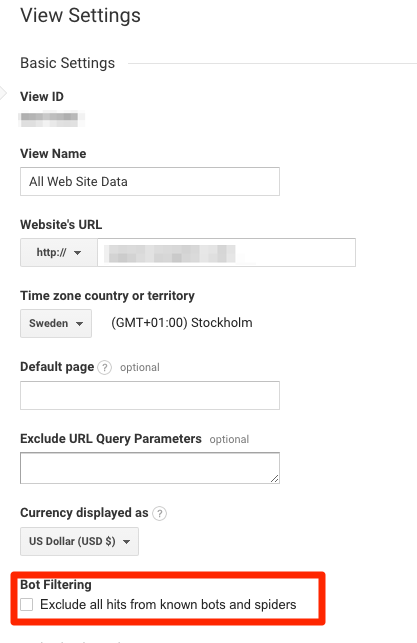
The most common is Google Analytics. To filter out Pingdom hits go to Administration > Reporting View Settings in Google Analytics > Tick the box to filter known bot traffic.
Basic/Uptime checks will not trigger any analytics that use JS, so for example uptime check hits will not show up in Google Analytics.
Real User Monitoring does not trigger analytics, since it only sends performance data from your sites visitors to us.
Page Speed Checks will trigger analytics, the tests are done using a real chrome browser. If you want to filter these out you can filter out any visitors with the word "pingdom" in the user-agent or requests from amazonaws.com (it's run from AWS)
Transaction Checks will trigger analytics, the tests are done using a real chrome browser. If you want to filter these out you can filter out any visitors with the word "pingdom" in the user-agent or requests from amazonaws.com.
To access lists of probe server IP addresses in various formats, see Pingdom URLs and IP addresses
You can read about how view filters in Google Analytics work: here: https://support.google.com/analytics/answer/1033162?hl=en
Navigation Notice: When the APM Integrated Experience is enabled, Pingdom shares a common navigation and enhanced feature set with other integrated experience products. How you navigate Pingdom and access its features may vary from these instructions.