View connection information
Hover the mouse over a node connection line to view connection information. The link speed indicated is the speed range defined in Connection Display Options.
To see the configured speed of interfaces, click Connection Display Options on the left options bar and select Show speed by txt.


The Link Speed options only affect the displayed coloring of layer 2 links by speed range, and the display of Speed by text. When link speed is cleared, all connections show as gray lines.
The Connection Display Options allow you to view layer 2 (Link layer), layer 3 (IP layer) information, virtual infrastructure and custom/manual connections.
When a connection has information from both layers 2 and 3, the connection only displays layer 2 information. To switch to layer 3 information, clear the Layer 2 (Switches) check box in Connection Display Options and select Layer 3.
Select Virtual Infrastructure to see the virtual machines running on discovered nodes
A custom connection is one that you manually add to the map with the Connect Devices tool.

To display custom connections in your map select Manual Connections in
Connection display options
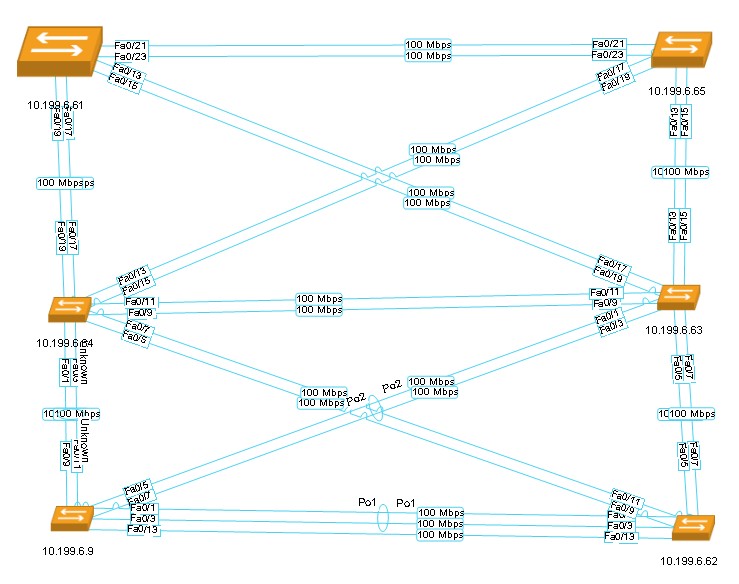
You can rollover any link on your map to see for each device in the link the Interface Name, Port Number, and any STP details; and the link speed by which data passes between the devices.

If you select Layer 3 for your Connection Display, you see the IP Address and Subnet for the devices.

If you select Layer 2 VLAN then you see any VLANS running through a connection; rolling-over the VLAN indications shows you the VLAN IDs associated with the connection along with the other connection information related to the devices.

Finally, Connection Jumps indicate the separation of links where they seem to intersect in your maps.

View aggregated links (EtherChannel)
During network discovery, by default, SolarWinds NTM version 2.2 obtains information about links that are aggregated through supported protocols (LACP, PAgp). Aggregated links are indicated by a loop around link lines:

Hovering over an aggregated link icon reveals information about related interfaces, protocols, STP statuses, interfaces, and link speeds:

