Manage and troubleshoot VMs using AppStack
With VMAN integrated with Server & Application Monitor (SAM) and the SolarWinds Platform, the AppStack maps your entire environment with a visual representation of objects and status. Every node and application, through VM clusters down to datastores, is displayed with icons indicating warning and critical issues.
At-a-glance, you can troubleshoot issues by reviewing the mapped applications and underlying infrastructure. Selecting an icon highlights related servers, to better track down and resolve the root cause. Regardless of your sprawling environment size, AppStack allows you to immediately detect issues and locate the source. With the expanded features of VMAN, you can further restart or suspend VMs, delete snapshots, and more.
In this example, a datastore encounters performance issues displaying a critical alert in the environment:
-
To view the entire network in the AppStack, click My Dashboard > Environment.
For this example, we find one of the datastores encountering an issue, possibly causing additional issues up through the AppStack. By resolving this issue, we could solve others. The tooltip displays limited free space compared to the capacity. This could lead to latency issues.

-
The AppStack highlights all connected servers to help pinpoint potential issues and related servers.
The overview shows the VM has 3 critical and 6 servers offline.

Only the related servers display with the datastore selected.

-
Click the server from this overview to open the details page and further troubleshoot.
A server-specific AppStack is also displayed in this page. As you resolve the issues, you can view this AppStack for locating associated issues throughout the environment.

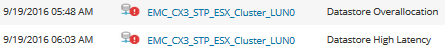
- Further reviewing the details page, you locate the captured alerts for the specific datastore, related servers, and additional performance metrics. Based on reviewing this data, the datastore shows:
A related VM with old snapshots

Datastore Overallocation and High Latency alerts for this VM
Using management tools and options in the VM details page, resolve these issues to clear the alerts. When resolved, the AppStack updates with the next polling to displays the latest status. If additional alerts are captured, use the AppStack to troubleshoot and drill down into the VMs as with this example.