Edit a VM specific threshold
As recommendations and alerts trigger, the default global thresholds may need to be adjusted for the baselines of your environment. In some cases, alerts may constantly trigger or cause false positives depending on factors including the amount of network traffic, capacity usage, and intended use of the cluster, host, datastore, or VM.
For this example, the CPU load for Microsoft Exchange VM servers can greatly differ than the load by normal application and storage VMs. The default thresholds for CPU load may trigger false positive alerts for the Exchange servers. To better monitor and generate alerts, create specific VM thresholds for the Exchange servers using Dynamic Baselines.
- Click Settings > All Settings.
- In the Product Specific Settings section, click Virtualization Settings.
-
In the Virtualization Settings section, click Virtualization Thresholds.
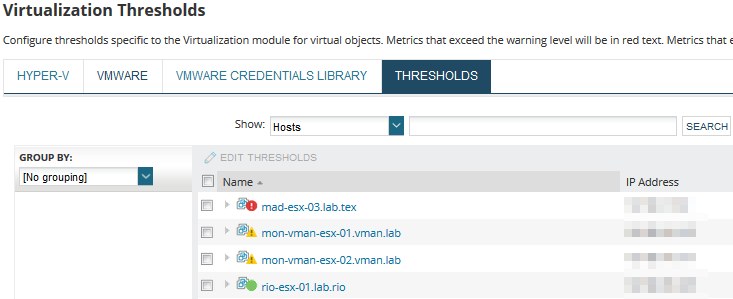
The Virtualization Thresholds page displays with a list of VMs.

-
Locate and select the checkboxes your Microsoft Exchange VMs, and click Edit Thresholds.
An Edit Properties page displays with thresholds to override and edit.
-
For the CPU load and Memory Usage, click Override Global Orion Threshold or Set Dynamic Threshold.
For this example, Microsoft Exchange VMs undergoes consistent, heavy CPU load, memory usage, and capacity usage. Setting a specific warning or critical amount could still generate false positives. Due to the constant fluctuation, using dynamic baselines allows the system to calculate the correct baselines based on actual tracked usage and metrics for the VM.

-
Click Latest Baseline Details to review the latest metrics tracked for the VM. The following example gives you insight to how the baselines are generated. Metric over Time tracks the full bandwidth of CPU load, indicating the actual average CPU usage. A spike in usage as noted in the tooltip shows the above average usage compared to the baseline.
VMAN creates a baseline of normal, warning level, and critical level of CPU usage directly from this captured data.

Click Cancel to close.
-
Click Use Dynamic Baseline Thresholds.
This option calculates and sets baselines based on monitored metrics over time for the Exchange servers, providing more accurate alerting and recommendations.
- Click Submit.
Learn more
To manage thresholds:
