Create log collection profiles
Create log collection profiles to process Windows and Linux log files for additional system analysis and troubleshooting. The log collection profile wizard guides you through selecting one or more SolarWinds Platform agent nodes, and then establishing specific file paths and files to monitor. See Deploy agents to monitored nodes for details about deploying the agent to monitored Windows or Linux-based nodes.
You can monitor text files of any format or extension, including .txt, .json, .config, .log, etc.
A log collection profile can contain one or more agents, and an agent can be assigned to one or more collection profiles.
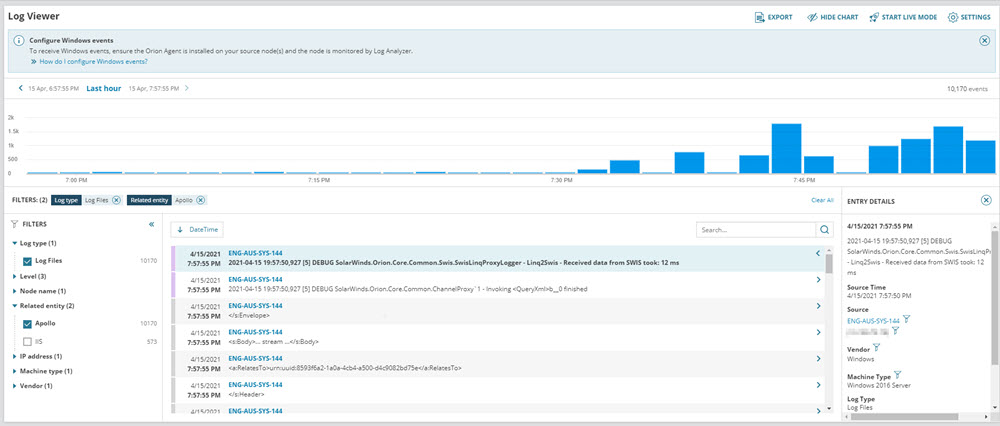
As messages stream into the Log Viewer, expand the Related Entity filter group, and then select a log collection profile filter to view targeted log file data.
- On the SolarWinds Platform Web Console menu bar, hover over My Dashboards and navigate to Log Viewer.
- Click Settings, then the Profiles tab.

- To begin the profile configuration sequence, click Create.

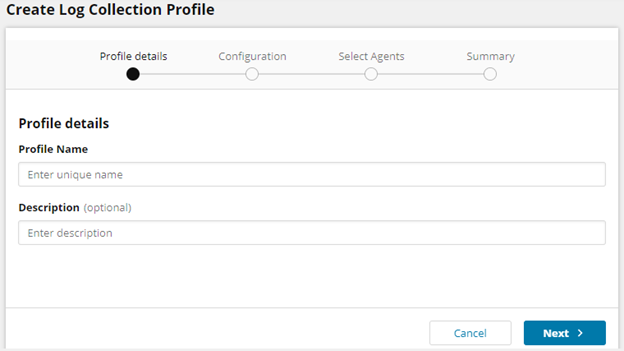
- Under the Profile details section, enter a profile name and a description (optional), and then click Next.
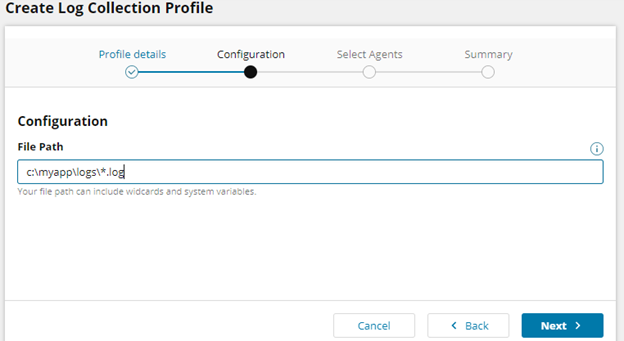
- Enter your file path (one per profile), and then click Next.
- The file path can include wildcards (for example,
c:\myapp\logs\1.log, orc:\myapp\logs\*.log.).- In Linux, the default file path for logs is
/var/log/*
- In Linux, the default file path for logs is
- You can also use wildcards to ensure that no logs are lost on file rotation by making sure the file path covers both current and already rotated files.

- The file path can include wildcards (for example,
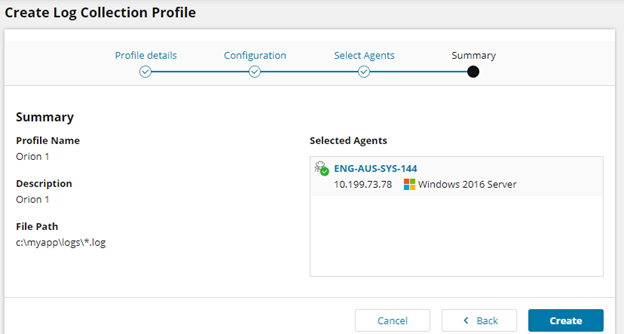
- Select one or more agent nodes, and then click Next to review the profile summary.
- Ensure you select agents for all devices from which log files will be collected.
- The log profile configuration is propagated to selected agents immediately after saving.
- Previously collected entries are still accessible in the Log Viewer.

- If no changes are needed, click Create. The new profile appears in the list of log file collection profiles where you can edit and delete profiles, and create new profiles.
Make note of the profile status indicators. Profiles with a error icon
 , may indicate an error such as an unlicensed profile node. Profiles with a warning icon
  , for example, may mean that no matching files are currently found. That could eventually change and the status will reset to green (refresh the page to confirm). Profiles with a green OK icon
  , indicate that the profile is configured correctly and functioning as intended. For errors and warnings, edit your profile to locate and correct the issue. After making edits, refresh you profile list.
You can now create custom rules to apply actions to specific log entries.
In the LA Log Viewer, expand filter groups to select specific logs for analysis and select an entry to view associated details, which includes the log file name, parsed level, and source time.

Learn how to edit a collection profile here.
