Optimize polling engines in your SolarWinds Platform deployment
This topic applies to all SolarWinds Platform products.
- Optimize the health of your monitoring system.
- Find out the number of monitored entities
- Distribute the load among polling engines
- Adjust how often the entities are polled
- Adjust the amount of data on a page.
- Adjust polling for special metrics, such as hardware health and metrics specific for your SolarWinds Platform product.
Optimize the health of your monitoring system
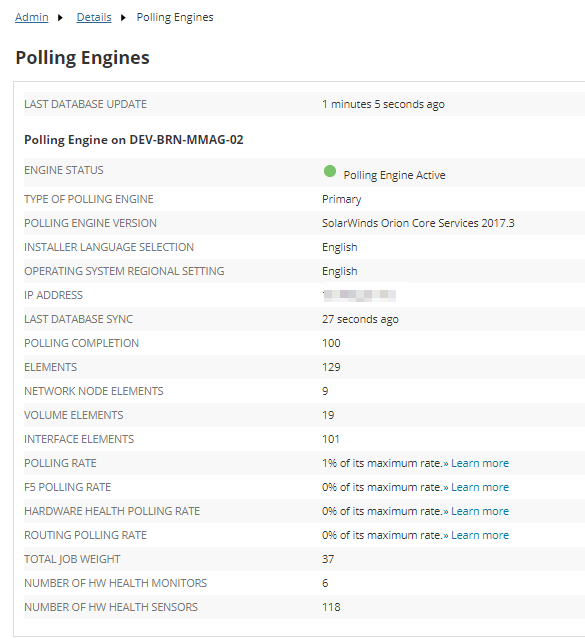
To verify the health of your polling, review the polling completion and rate.
Click Settings > All Settings > Polling Engines, and review the values for polling completion and rate.

Polling completion is the rate of polls across all polling engines completed without the need to delay polls. This value should be around 100. If you experience significant declines, verify that your SolarWinds Platform server meets the memory and CPU requirements.
Polling rate indicates the percentage of maximum polling rate for your server. If the polling rate reaches 85%, you will be notified. Consider adding an additional polling engine or return to default polling intervals if you have increased the default settings.
Are you polling hardware health, routing information, VIM, universal device pollers, F5 load balancers? Do you have any other SolarWinds Platform products installed? Review the polling rates for product-specific metrics. If the rate is close to 85%, adjust polling intervals and retention settings for the metric.
To learn how component monitors used in SolarWinds SAM can impact polling rates, see SAM polling recommendations and SAM scalability guidelines.
How many elements are polled by a polling engine?
- Click Settings > All Settings > Polling Engines.
- For each polling engine, review the number of polled elements.
Distribute the load
-
If the polling rate approaches 85%, add another polling engine before you reach 100%.
The maximum number of supported elements per polling engine depends on your product license. See Scalability Engine Guidelines by Product.
Unmanaged nodes are also counted as monitored elements.
-
If only one polling engine is overloaded, redistribute the polling jobs and divide polled nodes among your additional polling engines.
-
If the total of monitored elements by your deployment is close to 1,000,000 elements, deploy the Enterprise Operations Console in a distributed deployment.
Adjust how often metrics are polled
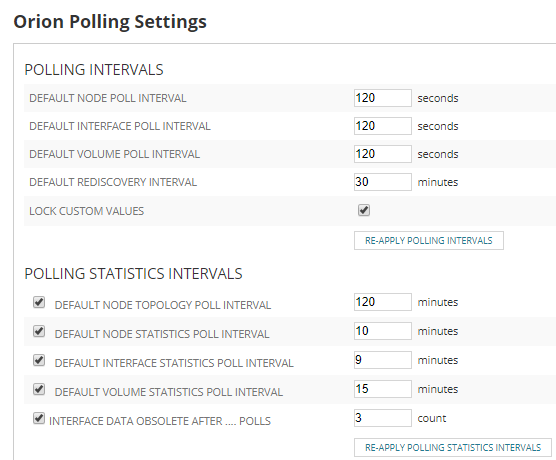
Make sure polling intervals for monitored elements are set to default:
-
Click Settings > All Settings > Polling Settings.
-
Make sure you are using default polling intervals:
- 10 minutes for nodes
- 9 minutes for interfaces
- 15 minutes for volumes
-
Review the polling statistics intervals, and set them to default values.
 To decrease the load on a polling engine:
- Increase the polling intervals and poll data less frequently than by default.
- Stop collecting data for some nodes.
Adjust the amount of data displayed on a page
If a SolarWinds Platform Web Console view takes long to load, scan the view for charts and review display settings for the chart.
Adjust settings for individual metrics and polling methods
Make sure your deployment meets the monitoring limits.
Agents
An agent is a software that provides a communication channel between the SolarWinds Platform server and a Windows or Linux /Unix computer. Deploy agents to collect data from Windows or Linux computers by deploying agents.
When you use agents as the polling method, be aware that a single polling engine can support up to 1,000 agents. See SolarWinds Platform Agent scalability.
Where to check
- Click Settings > All Settings > Manage Agents.
- Review the Manage Agents table.
To optimize
- Reduce the number of agents per polling engine to below 1,000.
- Distribute agents among polling engines:
- Click Settings > Manage Nodes.
- Select the agent node and click More actions > Change Polling Engine.
- Select another polling engine.
If you don't have additional polling engines deployed, the Change Polling Engine item is not available.
- Add additional polling engines.
Hardware health
Check the health of hardware health polling, and increase the poll interval for hardware health details if necessary:
-
Click Settings > All Settings > Polling Engines, and review the hardware health polling rate. If it is higher than 85%, review and adjust the poll interval.
-
Click Settings > All Settings > Polling Settings, and review the Hardware health polling settings.
-
Makes sure the Default statistics poll interval set to 10 or more minutes.

Topology data
Topology is an intensive polling job. Topology data does not change often on devices, so you don't need to poll this information very often.
Changing the topology settings affects how often your maps are updated.
By default, SolarWinds Platform polls topology data even if you are not using topology widgets. Make sure you are using the default polling settings:
- Default polling is 120 minutes (Orion Platform 2017.3 or later)
- Default polling is 30 minutes (Orion Platform 2017.1 or earlier)
Optimize topology polling
-
Click Settings > All Settings > Polling Engines.
-
Edit the Default node topology poll interval to a few times a day. This setting determines how often the topology data is polled.
-
Go to Advanced Configuration options. Paste the following into your browser search field, right after the hostname or IP address:
/Orion/Admin/AdvancedConfiguration/Global.aspx -
Set the frequency for topology calculation to 20 hours:
On the Global tab, search for Topology, and enter 20:00:00 as theTopologyCalculationFrequency. This setting determines how often SolarWinds Platform takes the polled data, performs calculations and places results in the Topology connections. Default node topology and topology calculation frequency should match.
-
Save your settings and click Restart All to restart the SolarWinds Orion Module Service.
Syslogs
Use Orion Log Viewer to collect, search, filter, and alert on syslogs and SNMP traps from the SolarWinds Platform Web Console:
- Orion Log Viewer reduces the strain on your SolarWinds Platform database by sending syslogs and traps to a separate database for log data.
- You can set up rules to determine whether to keep or discard specific syslog and trap messages.
SNMP Traps
Use Orion Log Viewer to collect, search, filter, and alert on syslogs and SNMP traps from the SolarWinds Platform Web Console:
- Orion Log Viewer reduces the strain on your SolarWinds Platform database by sending syslogs and traps to a separate database for log data.
- You can set up rules to determine whether to keep or discard specific syslog and trap messages.
Module-specific statistics
In addition, individual SolarWinds Platform products provide additional monitoring options, such as:
- Custom SNMP-based monitors: In NPM, Universal device pollers can collect statistics based on OIDs.
- NetPath™
Universal Device Pollers
With NPM, you can create custom monitors, so-called Universal Device Pollers (UnDP) that return values for specific metrics.
NPM supports up to 10,000 UnDPs per polling engine.
Where to check
- Click Settings > All Settings > Database Details.
- Scroll down, click Total elements per poller, and review the number of custom node and custom interface pollers for each polling engine.
To optimize:
When you reach the supported number of UnDPs per polling engine, consider the following recommendations:
-
Add additional polling engines.
- Increase polling intervals. UnDPs use the default Node polling intervals:
Click Settings > All Settings > Polling Settings.
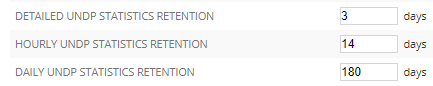
Adjust the statistics retention to the default settings or shorter.
Find out what nodes have high numbers of custom node pollers
-
Run the following query to identify nodes with the most custom node pollers.
/* This will show the total count of UnDPs per engine */
SELECT
    n.EngineID,
    e.ServerName,
    n.Caption,
    n.IP_Address,
    cpa.NodeID,
    COUNT(cpa.CustomPollerID) AS [Total Pollers]
FROM CustomPollerAssignment cpa
JOIN NodesData n ON cpa.NodeID = n.NodeID
JOIN Engines e ON e.EngineID = n.EngineID
GROUP BY
    n.EngineID,
    e.ServerName,
    n.Caption,
    n.IP_Address,
    cpa.NodeID
ORDER BY [Total Pollers] DESC;
You can use this query to create a report. Follow the steps in Create a report. When selecting objects to report on, select Advanced Database Query (SQL, SWQL) and copy and paste this query.
To optimize:
- Move the nodes with the highest number of custom pollers to an additional polling engine to distribute the load.
NetPath™
You can add up to 100 paths per polling engine.
You can add 10-20 paths per probe.
Where to check
- Click Settings > All Settings > Database Details.
- Scroll down, click Total elements per poller, and review the number of probes for polling engines.
To optimize:
- Verify that your deployment meets NetPath requirements.
- Distribute NetPath probes among polling engines.
- Add additional polling engines.
The scripts are not supported under any SolarWinds support program or service. The scripts are provided AS IS without warranty of any kind. SolarWinds further disclaims all warranties including, without limitation, any implied warranties of merchantability or of fitness for a particular purpose. The risk arising out of the use or performance of the scripts and documentation stays with you. In no event shall SolarWinds or anyone else involved in the creation, production, or delivery of the scripts be liable for any damages whatsoever (including, without limitation, damages for loss of business profits, business interruption, loss of business information, or other pecuniary loss) arising out of the use of or inability to use the scripts or documentation.