Discover your network
SolarWinds User Device Tracker (UDT) is designed to be used as part of the SolarWinds Platform suite of products or as a standalone application. If you are already using SolarWinds Platform to monitor your environment, and have created a database of nodes and associated elements, you can skip this section and start adding nodes for UDT monitoring.
Discovery is the term used to describe the process SolarWinds Platform uses to identify network elements.
The tabs shown as you proceed through wizard depend on the SolarWinds Platform products you have installed. Click Next to skip a tab.
Before you discover your network:
- Determine which type of devices you want to monitor and which you want to ignore
- Enable the networking devices you want to monitor using SNMP
- Enable Windows devices for WMI
- If the Discovery Wizard page is not displayed when you launch UDT, click Settings > Network Discovery.
If you have already set up a discovery, you can add another by clicking Add New Discovery.
- Click Start if necessary to display the following page:
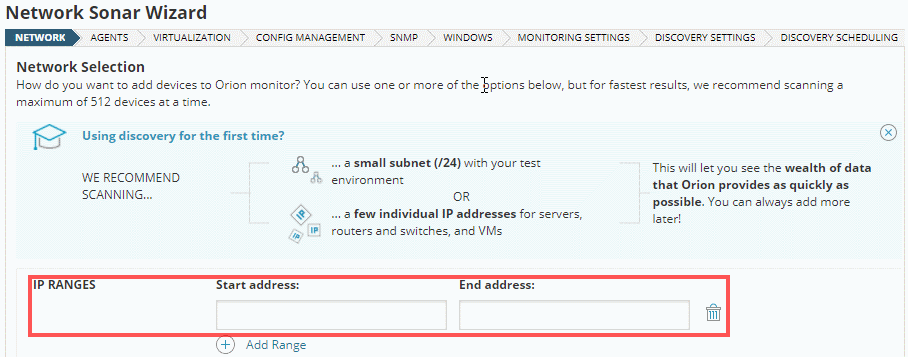
- If this is your first discovery, and you want to start seeing real data as soon as possible, just add a limited range of IP addresses by adding a start and end address.
As you scale your implementation, you can also use the following scanning options:
Option Description IP Ranges Use this option to scan one or more IP ranges. If you have many IP ranges to scan, consider adding multiple discovery jobs rather than including all ranges in a single job. Subnets Use this option to scan every IP address in a subnet.
SolarWinds recommends scanning at most a /23 subnet (that is, a maximum of 512 addresses). Scanning a subnet returns everything that responds to ping, so we recommend only scanning subnets where you want to monitor the majority of devices.IP Addresses Use this option for a limited number of IP addresses that do not fall in a range. Active Directory Use this option to scan an Active Directory Domain Controller.
You can add an Active Directory Domain Controller, as described later in this guide, for tracking user logins.
- Click Next until the SNMP tab is displayed.
- On the SNMP tab:
- If all devices on your network require only the default SNMPv1 and SNMPv2 public and private community strings, click Next.
- If any device on your network uses a community string other than public or private, or if you want to use an SNMP v3 credential, click Add Credential and provide the required information.
If you use SNMPv3, you need to grant access to all Bridge MIBs. For more information, see the knowledgebase article, Enable SNMPv3 access for layer 2/3 Bridge MIBs for Cisco IOS.
- On the Windows tab, click Add New Credential and provide the required information, if you want to discover WMI or RPC-enabled Windows devices.
- On the Monitoring Settings tab, select Manually set up monitoring after devices are discovered, if this is the first time you have run discovery. This will give the opportunity to review the list of discovered objects, and decide which to monitor and which you are not interested in.
- On the Discovery Settings tab, enter a name for this network discovery, and click Next.
- On the Discovery Scheduling tab, accept the default frequency, and click Discover to run the discovery immediately.
Discovery can take anywhere from a few minutes to a few hours, depending on the number of network elements the system discovers.
After searching your network, the Network Sonar Results Wizard displays how many of each device type has been detected.
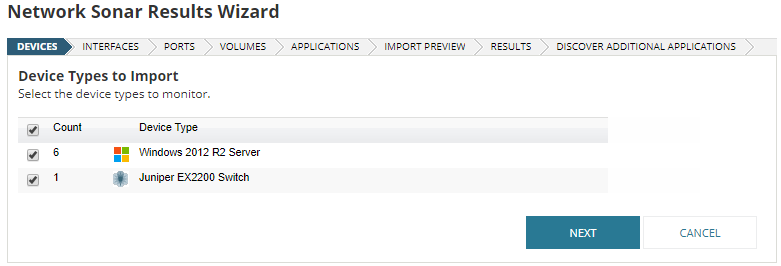
When you manually run discovery, the system automatically selects all network elements to be monitored. You must clear the check boxes for those elements you do not want to be monitored.
Discovered elements do not count against your license count; only elements that you import into the SolarWinds Platform database count against your license.
- Ensure only the device types you want to monitor are selected, and click Next.
- On the Ports tab, specify the ports you want to monitor.
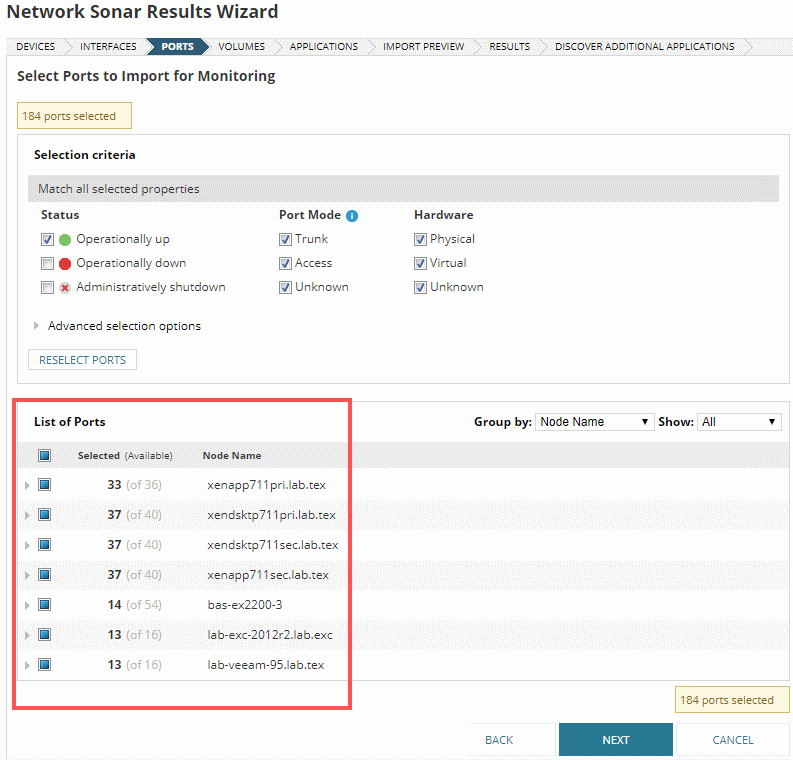
By default only ports with the UP status are selected.
- Expand the nodes to verify your selection.
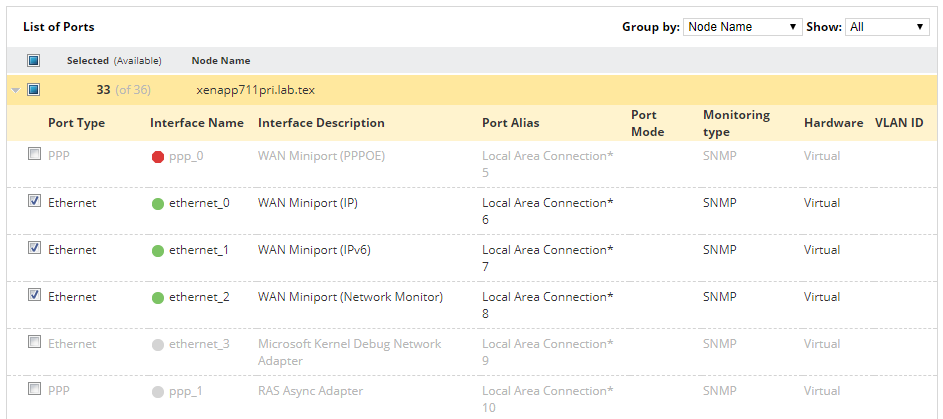
- Click next until the Import Preview tab is displayed, and click Import.
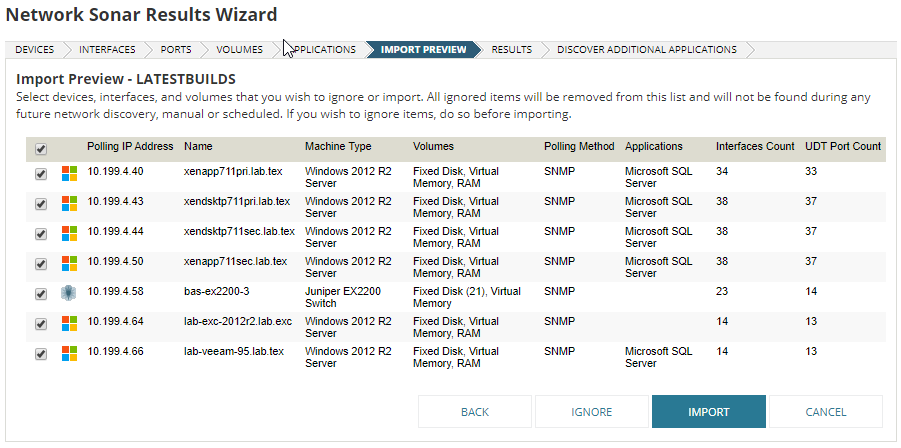
- When the import is complete, go to My Dashboards > Home > Summary.
- The nodes you selected are displayed in the All Nodes widget.
- The Event Summary widget shows these nodes were added.
You can now add these nodes to UDT for monitoring.
