Select SolarWinds Platform Nodes for monitoring with UDT
Whether you are already monitoring nodes with the SolarWinds Platform or have just run a discovery job to find nodes specifically for UDT, you now need to select the nodes you want to monitor.
- In the SolarWinds Platform Web Console, click Settings > All Settings > UDT Settings.
- Select Manage Ports.
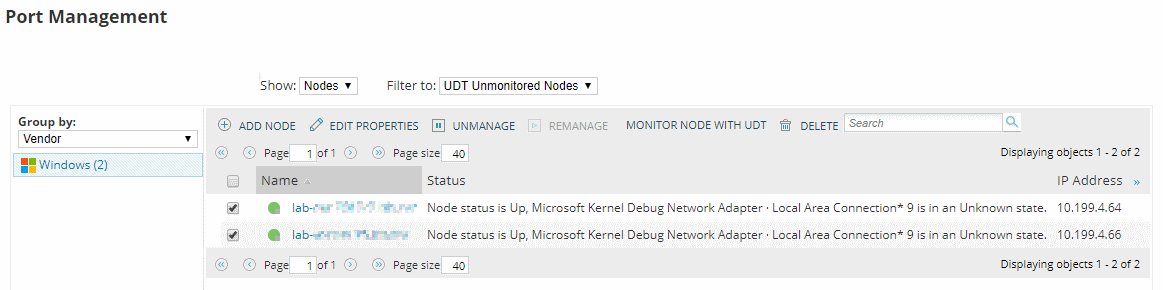
- From the Show dropdown, select Nodes.
- From the Filter to dropdown, select UDT Unmonitored Nodes.
- Select the nodes you want to monitor, and click Monitor Node with UDT.
To immediately start monitoring all ports, select UDT Monitored Nodes from the Filter to dropdown. Then select all ports, and Click Poll now.
- Navigate to My Dashboards > Device Tracker > Device Tracker Summary.
Within a few minutes the All UDT Nodes widget should start showing ports, as shown below.
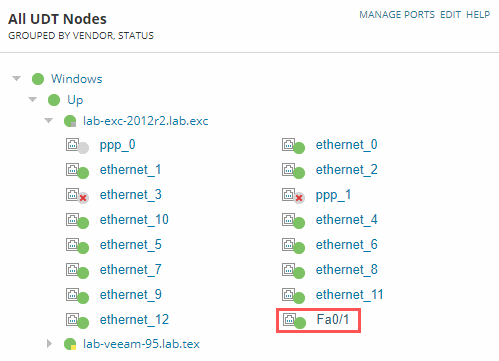
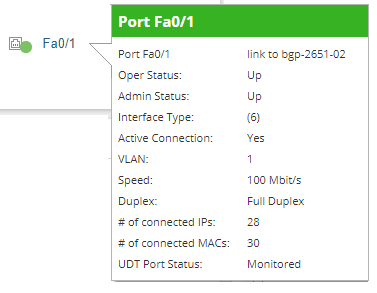
Hover over a port to display a summary.
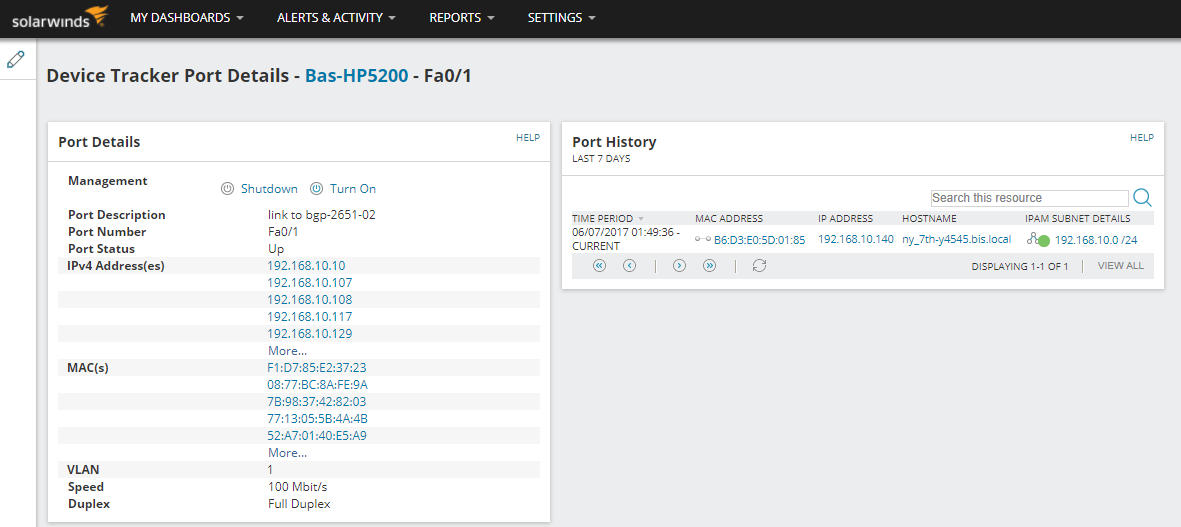
Click on a port to display its details page.