Tail-based sampling
Tail-based (or tail) sampling is a sampling technique where the system decides which traces to keep after a request completes, allowing it to retain high-value traces. Unlike head-based sampling, in which samples are evaluated at the beginning of a request, tail-based sampling occurs after the request finishes so that decisions are based on the complete picture of the trace sampled.
Tail-based sampling is supported by APM libraries that export via OTLP and achieved through standard OpenTelemetry Collector components. The core concept is that requests sent to the service (or services, for a distributed workflow) are head-sampled at a high rate by the APM library and the resulting traces are exported to OpenTelemetry Collector instances deployed in your environment. The traces are then filtered by the collector’s tail sampling processor based on your custom policy and only the retained ones are forwarded to SolarWinds Observability.

Tail sampling makes the rich context of a trace available to the sampling decision so that it is possible, for example, to capture only errored or high-latency requests, or sample a particular transaction at a higher rate than others. With this power comes trade-offs such as the increased complexity in deploying, configuring, and monitoring collectors in your environment. There is also the risk of unintended high volume of traces exported and the associated increase in costs; to prevent this, APM libraries still impose an upper bound rate limit even when this feature is enabled.
Tail-based sampling is recommended for core workloads only and for selective purposes, such as looking at more errored or high latency requests. SolarWinds will limit the number of traces if it exceeds fair use as seen within the customer base, reverting your service instance(s) to lower sample rates.
This documentation provides best-practice recommendations and example configurations that should be customized to suit your needs. It also assumes familiarity with setting up a standard head-sampled service where the APM library exports directly to SolarWinds Observability.
Prerequisites
An OpenTelemetry Collector deployed in your environment. We recommend using the SolarWinds OpenTelemetry Collector, configured and deployed in the gateway pattern recommended for tail sampling where the first tier instances use the load-balancing exporter to export to the second tier that runs the tail sampling processor. This is described in the Collector deployment example section.
The service(s) in a workflow must be instrumented by a supported APM library version to tail-sample a complete distributed trace.
The list of services to enable for tail sampling must be provided to customer support, in order to enable high head sampling rate in the APM library. These services should already be instrumented and visible in SolarWinds Observability, to be able to confirm the related services in a distributed workflow, and to access the trace details that are required to configure tail sampling policies.
The service(s) must be configured to export traces to the OpenTelemetry Collector deployed in your environment.
Certain features such as code profiling and exemplar collection should be disabled to prevent unnecessary overhead, see details below in Limitations.
Collector deployment examples
These examples provide a quick start to try out tail sampling using a SolarWinds OpenTelemetry Collector distribution. They highlight core concepts including:
-
The first-tier collector uses load-balancing exporter with
traceIDrouting key to send spans to second tier collectors for tail sampling. -
A set of second-tier collectors have tail sampling processors configured with desired policies.
-
The collectors include the
solarwindsextension for enhanced entity inference and enable collector internal telemetry and tail sampling processor policy tracking for diagnostics.
Docker Compose
See the Tail Sampling Example in our GitHub repository.
Kubernetes
Coming soon.
Configuration
Load-balancing by trace ID
The example in this file demonstrates the simplest backend scaling and resiliency configuration. Refer to the official documentation for details on configuring backends to suit your deployment. Also note this upstream section on scaling stateful collectors, which is particularly relevant for dynamic environments like Kubernetes.
Tail sampling processor policy
Refer to the official documentation for details on creating policies that suit your needs. The examples in this file demonstrate common scenarios, and SolarWinds-specific cases are highlighted below.
Custom transaction name
When the transaction name for a trace is customized via SDK or configuration, the custom name is set as the attribute sw.transaction on the service/ local root span:
{
  name: filter-custom-transaction-name,
  type: string_attribute,
  string_attribute: { key: sw.transaction, values: [value] },
}
Trigger trace
SolarWinds Digital Experience Monitoring probes use trigger trace when making requests to the monitored target. The resulting trace allows deep insight from the website to the underlying service(s). Thus, it is recommended to preserve triggered traces by checking the TriggeredTrace span attribute, which is set on any triggered trace:
{
  # Always sample trigger-traced requests
  name: trigger-trace-policy,
  type: boolean_attribute,
  boolean_attribute: { key: TriggeredTrace, value: true },
}
APM library
The following APM libraries support tail sampling. We recommend upgrading to the latest available version and assume the latest version is used in examples.
-
.NET – versions 6.1.0 and above, when OpenTelemetry is enabled.
-
Code profiling is disabled when OpenTelemetry is enabled.
-
-
Go – versions 1.2.5 and above.
-
Java – versions 2.10.0 and above.
-
Node.js – versions 14.0.2 and above.
-
PHP alpha – versions 9.0.0-alpha.1 and above.
-
Python – versions 4.0.0 and above.
-
Ruby – versions 7.0.0 and above.
As mentioned in prerequisites the service should first be added to SolarWinds Observability using a supported version of the APM library listed above.
Once tail sampling settings are enabled for the service by customer support, and the OpenTelemetry Collector deployment is available in your environment, the only APM library configuration change needed is to configure it to export traces to the first tier collector. An example setting the endpoint for all signals:
OTEL_EXPORTER_OTLP_ENDPOINT=<first-tier-collector-endpoint>
See OTLP Exporter Configuration for details, and check the zero-code config pages (.NET, Java, Node.js, Python and PHP) or the SDK pages (Go, Ruby) for language-specific information.
Monitoring and diagnostics
Telemetry association to collector
The collector deployment examples configure the SolarWinds Extension and Processor so that each collector instance is assigned a unique name by the extension:
extensions:
  solarwinds:
    collector_name: ${env:SOLARWINDS_OTELCOL_NAME}
The processor enriches data flowing through the applicable pipeline with this collector name, so that a SolarWinds OTel Collector entity is created in SolarWinds Observability and correlated to the telemetry. You can find it in Entity Explorer by searching on the configured name (for example, collector-lb, collector-ts1) or get a list of all Infrastructure entities of the type SolarWinds OTel Collector:
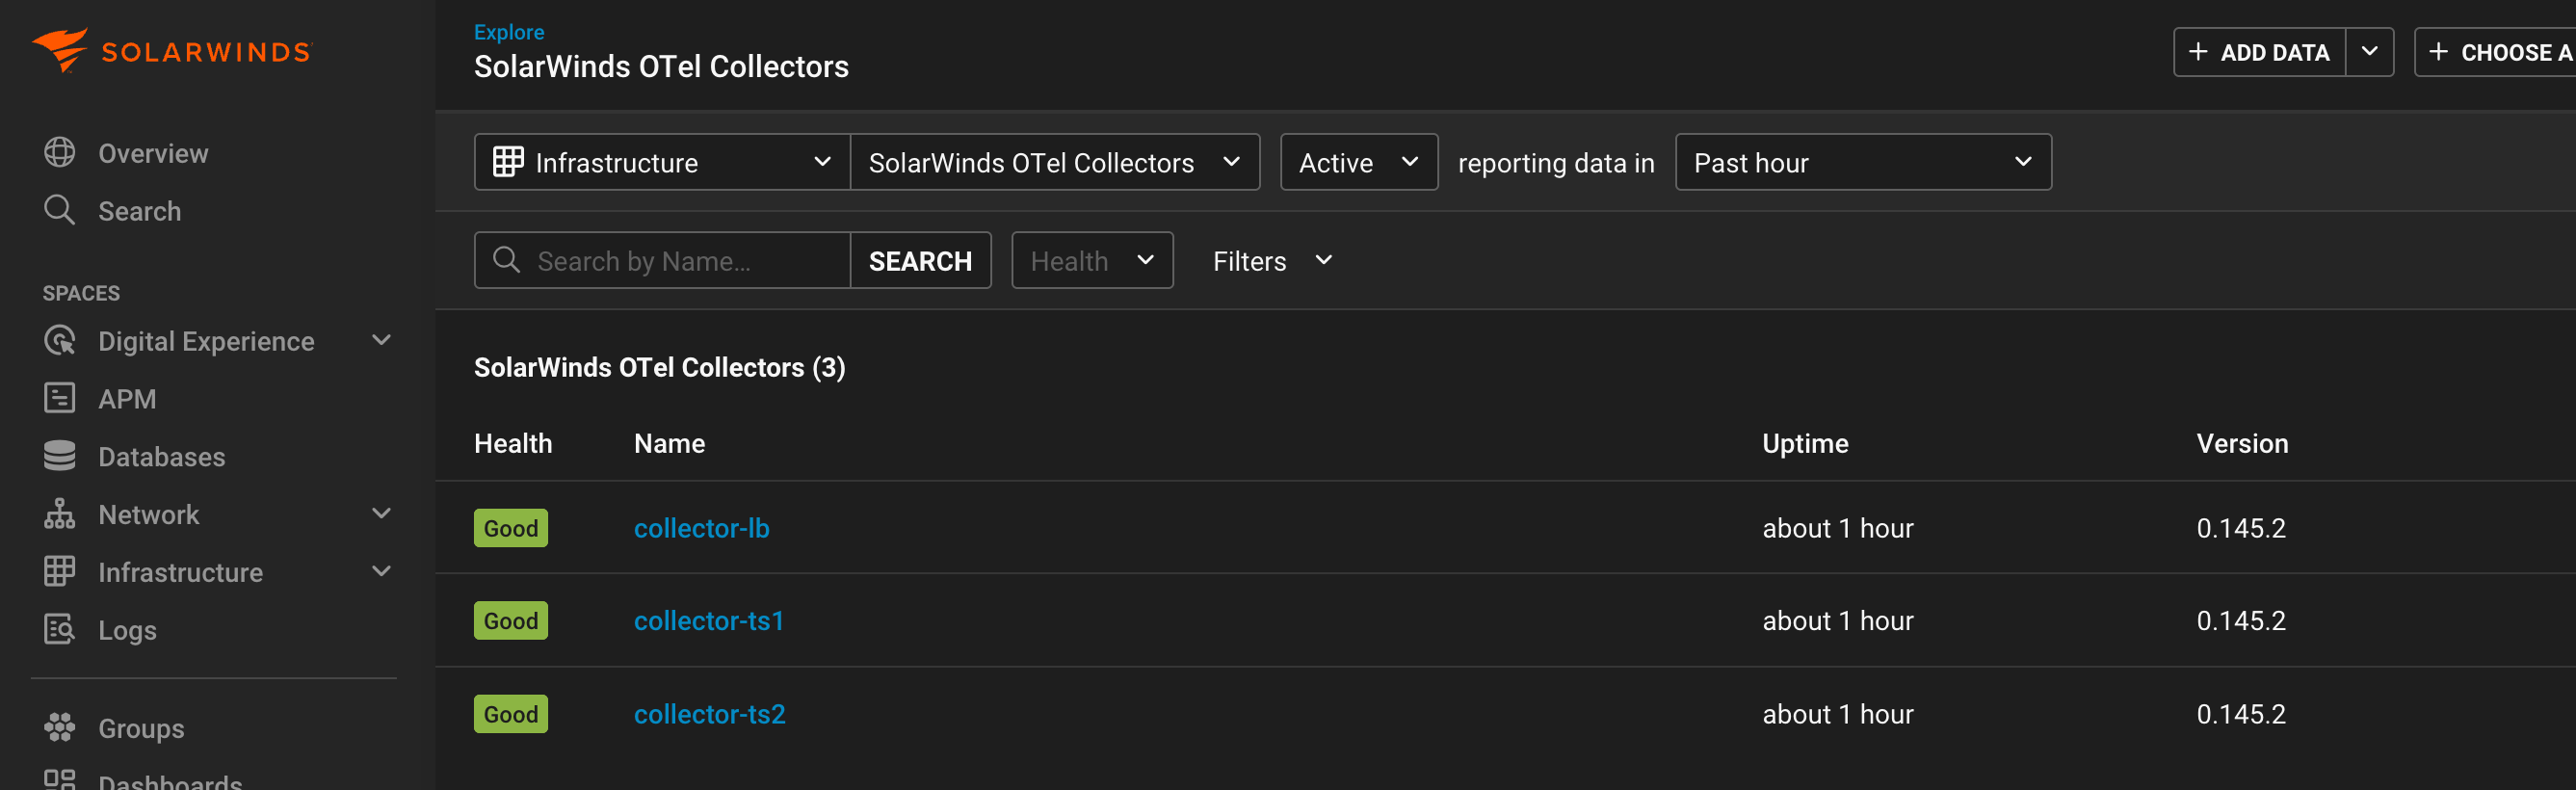
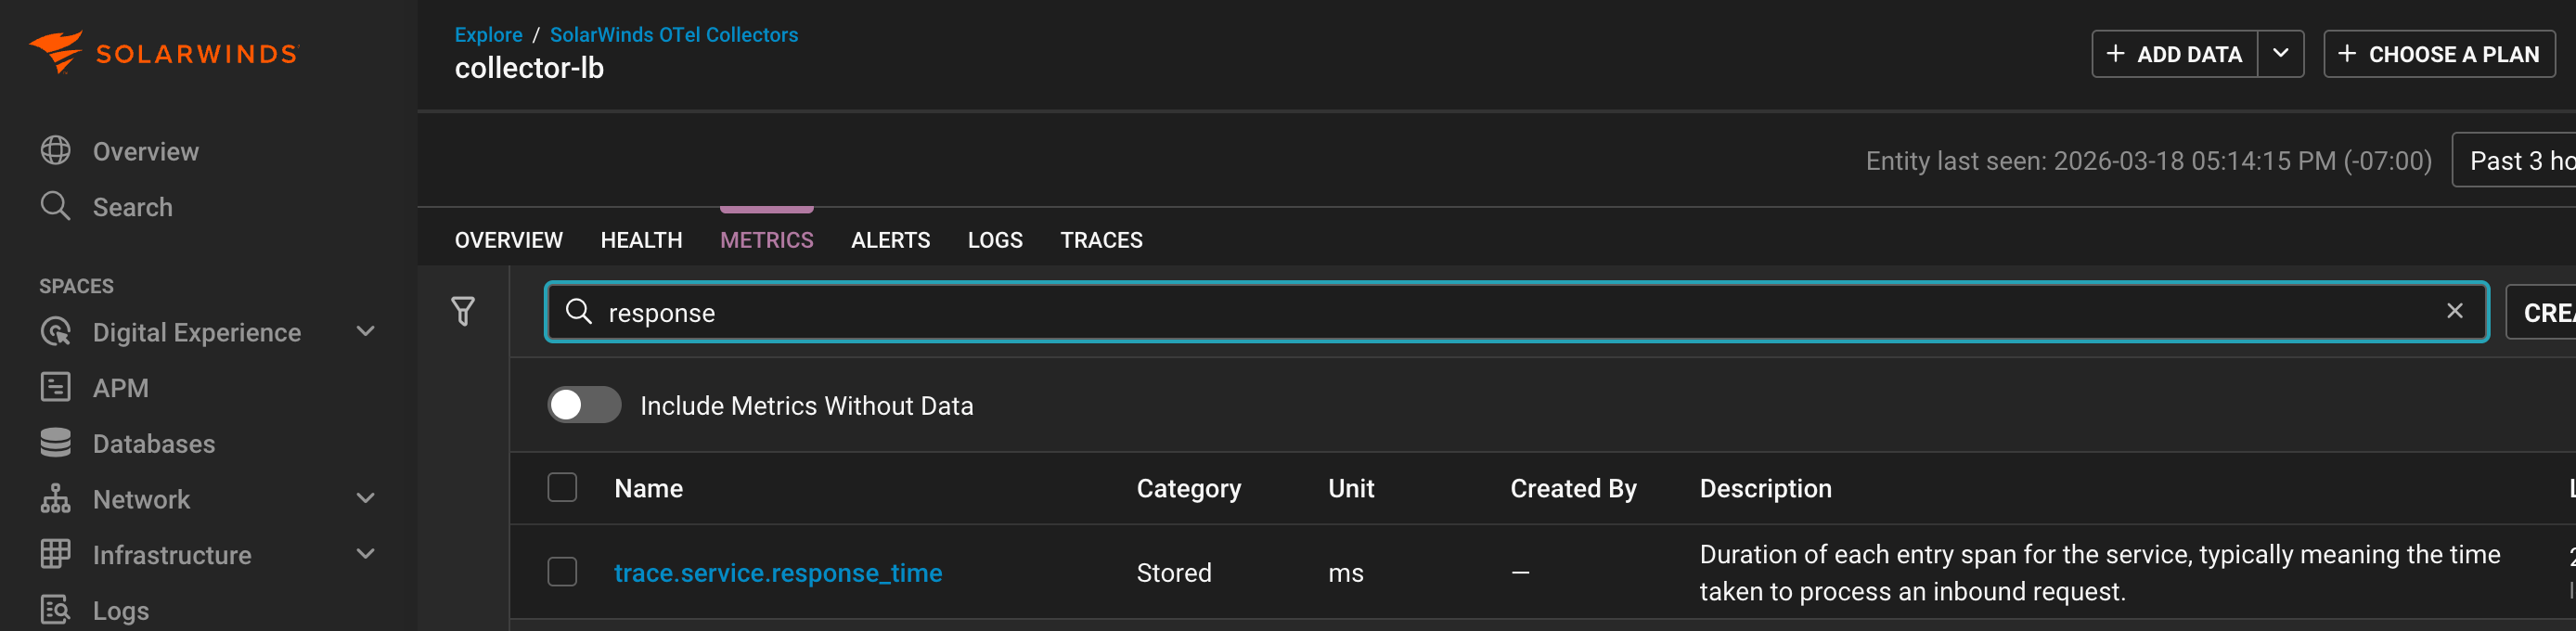
In the entity details view for a particular collector, you can use the LOGS, METRIC, and TRACES tabs to see the associated telemetry. Our example deployment configures logs and metrics pipelines to the first tier collector-lb, and traces pipeline to the second tier collector-ts1, collector-ts2 collectors, which can be seen in the entity detail view tabs:
collector-lb

collector-ts2

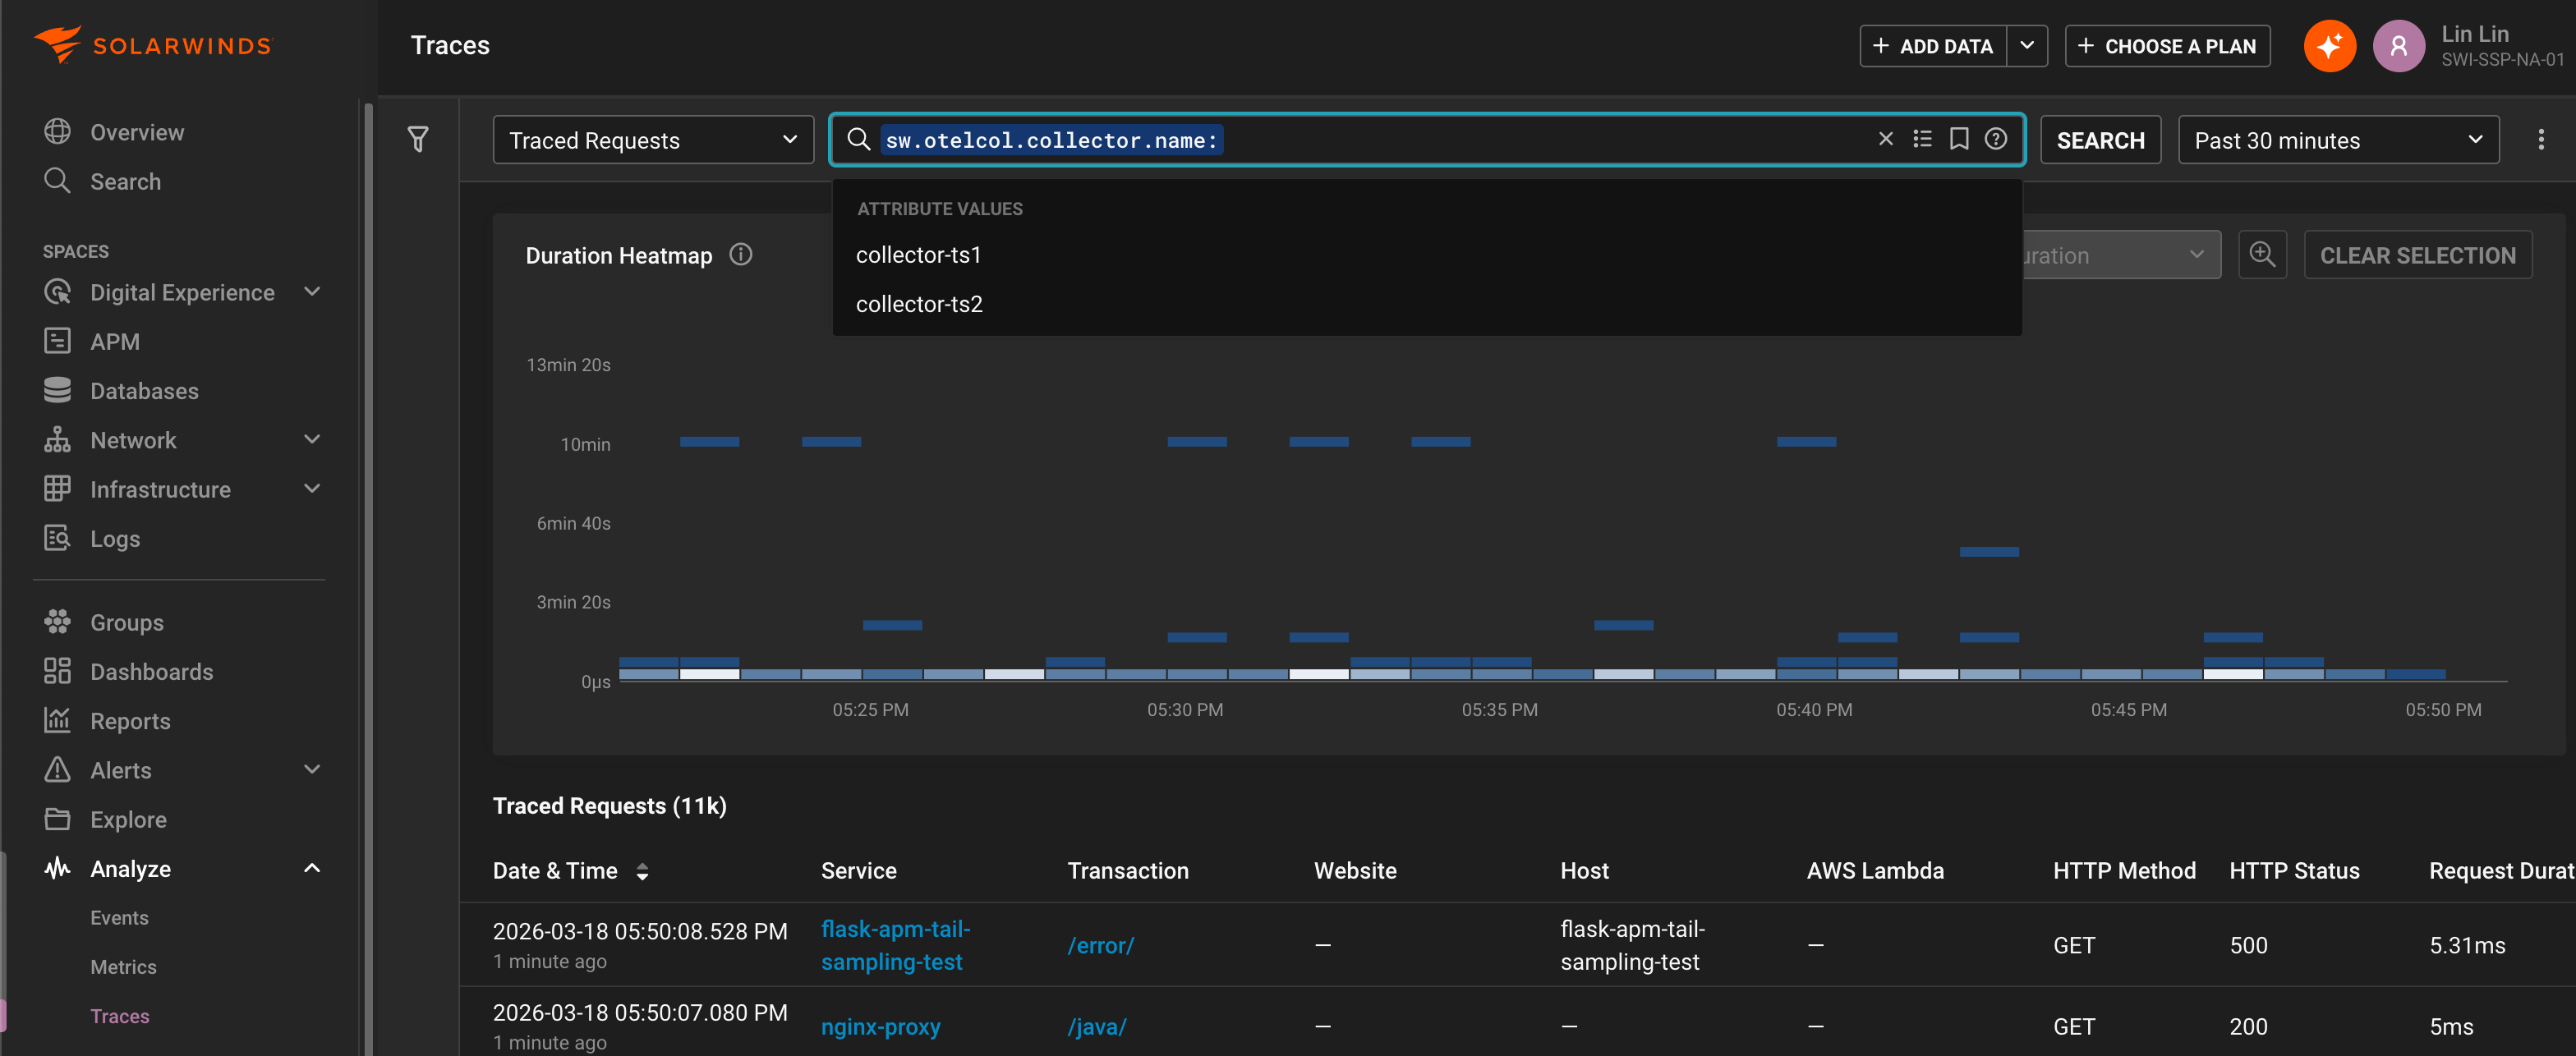
Conversely, the Metrics Explorer and Traces Explorer views can be used to analyze collector association across telemetry, for example grouping by the enriched collector name attribute sw.otelcol.collector.name:

Internal telemetry
The deployment examples also enable collector internal telemetry export, so that metrics useful for monitoring and diagnostics of the collector and its components are available in SolarWinds Observability. Most of these metric names are prefixed with otelcol_, you can use the METRICS tab in the entity details view to see them for a particular collector or use the Metrics Explorer view to analyze them across collectors.
Below are references to the internal telemetry relevant to tail sampling:
-
Monitoring best practices and Scaling the Collector highlight key collector health metrics.
To gain insight on which tail sampling policy was used for a trace, the deployment examples also enable policy tracking. You can see these tailsampling.* attributes on individual traces in the details view or analyze across traces in the Traces Explorer view:


Limitations
Ensure that code profiling is disabled in APM Java when tail sampling is enabled.
The code profiling feature for APM .NET and APM Java are not supported for tail sampling. This is due to code profiling still using the legacy proprietary data export protocol instead of OTLP. Importantly, since profiling is performed for every in-process traced (head-sampled) request, the instrumented application could incur significant performance penalty in a tail sampling enabled service. Ensure that code profiling is disabled (the default) in APM Java before setting up tail sampling.
SolarWinds recommends disabling exemplars when tail sampling is enabled.
When tail sampling, traces linked to by metric exemplars may be dropped, thus reducing the usefulness of exemplars. Additionally, the default criteria for collecting exemplars is the TraceBased exemplar filter that includes all in-process traced (head-sampled) requests, which could incur more overhead in a tail sampling enabled service. The AlwaysOff exemplar filter can be used to disable exemplar collection, for example by setting this environment variable:
OTEL_METRICS_EXEMPLAR_FILTER=always_off