Service statistics
On this page
Introduction
Service statistics are available for Incidents, Problems, and Changes.
Incidents service statistics
It is important for service agents to have visibility into relevant events occurring within your organization. Service Desk Service Monitoring can assist you in prioritizing your service desk work.
It:
- Highlights the incident lifecycle, which can help you focus on time spent per incident state and per assignee.
- Highlights the calculated time from incident creation to incident closure.
Such information can help you determine whether there are bottlenecks preventing continuous workflow.
Problems and Changes service statistics
Service statistics for problems and changes provide insights for your organization to make data driven decisions and improve services.
Navigation
Service Desk > Incidents (or > Problems or > Changes)
Use service statistics
-
Navigate to Service Desk > Incidents (or > Problems or > Changes).
-
From the index page, click the title of a single record.
-
On the right, notice the pane displaying information about the ticket.

-
Click Service Statistics to reveal a small details screen that includes valuable information.
Options in the dropdown are:
- High-level
- State changes
- Assignee changes

After selecting one of the options above, the available statistics can be selected from the second dropdown.
-
Use the descriptions in the table below to guide you in making dropdown selections to change your view.
The top dropdown menu lets you select the type of information you see. High-level provides an overview of the time duration for Time Spent and Time Passed events.
Time Spent and Time Spent (Business Hours) Incidents Problems Changes To assignment ü
ü
ü
To first response ü
ü
ü To resolution ü
To close ü
ü
To Approval ü
To Decline ü
To Close Completed ü
To Closed Incomplete ü
Time Passed since Creation and Time Passed since Creation (Business Hours) Incidents Problems Changes To Assignment ü
ü
ü
To First Response ü
ü
ü To Resolution ü
To Close ü
ü
To Approval ü
To Decline ü
To Close Completed ü
To Closed Incomplete ü
For high-level statistics, if the state has changed multiple times to the same state, the counter displays the time passed from creation to the most recent change.State Changes provide a historical account of state changes, reflecting the lifecycle of the incident, problem, or change as it transitions from one state to another (for example, from New to Assigned), showing both the time spent in each state and the time elapsed from creation to each specific state.
Time Spent: Time spent in each state Example:
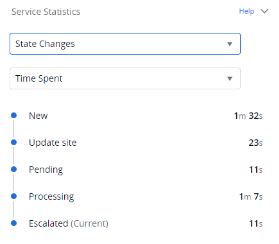
Time Spent (Business Hours): Time spent on each state based on business hours
Time Passed Since Creation: Time passed from creation to each state
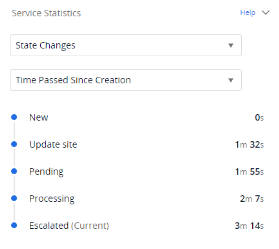
Time Passed Since Creation (Business Hours): Time passed from creation to each state based on business hours
Assignee Changes provide a historical account of assignee changes, reflecting the lifecycle of the incident, problem, or change as it transitions from one assignee to another showing both the time spent by each assignee and the time elapsed from creation to each assignment.
Time Spent: Time spent by each assignee on the incident, problem, or change 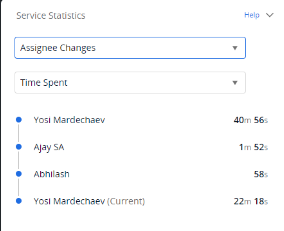
Time Spent (Business Hours): Time spent by each assignee based on business hours
Time Passed Since Creation: Time passed from creation to each assignee
Time Passed Since Creation (Business Hours): Time passed from creation to each assignee change based on business hours
Report data exports
You can export data from an open report in table view.
-
In the upper right, click the ellipsis icon, and then select Table view.
-
After the table is displayed, click the dropdown arrow next to Actions.
-
From the dropdown menu, under Export, select the format you need. Options are:
- CSV - All Columns
- CSV - Current View
- XML
- RSS
Terminology differences between system user interface and exported CSV columns
Some differences exist between what you see in the Service Desk user interface and exported CSV content. For example, in a CSV export you can see To Closure and Service Time to Closure.
- Service Time to Closure represents the time passed since creation to Closure measured in business hours.
- To Closure represents the total elapsed time from creation to closure.
Related topics
- Reports - Time Centric: Service statistics over time
- Service statistics widgets for your dashboard