Getting Started with SQL Sentry Performance Analysis
Performance Analysis Features
Performance Analysis allows you to gather and display detailed information about your monitored servers within your environment. Performance analysis provides ease of access through a variety of tabs.
Note: Available tabs and features vary by target type (e.g. SQL Server, SSAS, Windows, etc.).
Dashboard
The Dashboard provides a graphical representation of the monitored server activity through a variety of graphs. Color coded graphs distinguish between what's used by the instance versus any other processes.

Note: The information shown on each tab is relevant to the time shown on the toolbar. See how the server looked at a given date or time by selecting the desired time in the Start and End drop-down boxes. Select Sync to synchronize all the tabs within the same time frame.

The left side displays Windows metrics for the monitored server.

The right side displays SQL server metrics for the monitored instance.

Note: If you are running in Limited access mode, you can only view the instance level metrics.
Additional Information: For more information about the Performance Analysis Dashboard, see the Dashboard article.
Processes
The Processes tab presents a list of processes that are running on your monitored server. Metrics related to the resource utilization of these processes is also shown.

Disk Activity
The Disk Activity tab displays information about the data and log files on your server. This tab displays the latency for reads and writes from files on your disk, and the latency from the system to the disk controllers.

Additional Information: For more information about the Disk Activity tab, see the Disk Activity article.
Disk Space
The Disk Space tab displays information about the size of the files on your disks, and the free space on your disks. Additionally, this tab provides detailed information about Data and Log files (auto growth settings, number of VLFs, etc).

Additional Information: For more information about the Disk Space tab, see the Disk Space article.
Top SQL
The Top SQL tab displays potentially problematic queries and procedures running on your monitored instance. Top SQL also provides a look at the execution plan diagrams and history of queries and procedures captured by SQL Sentry.

Additional Information: For more information about the Top SQL tab, see the Top SQL article.
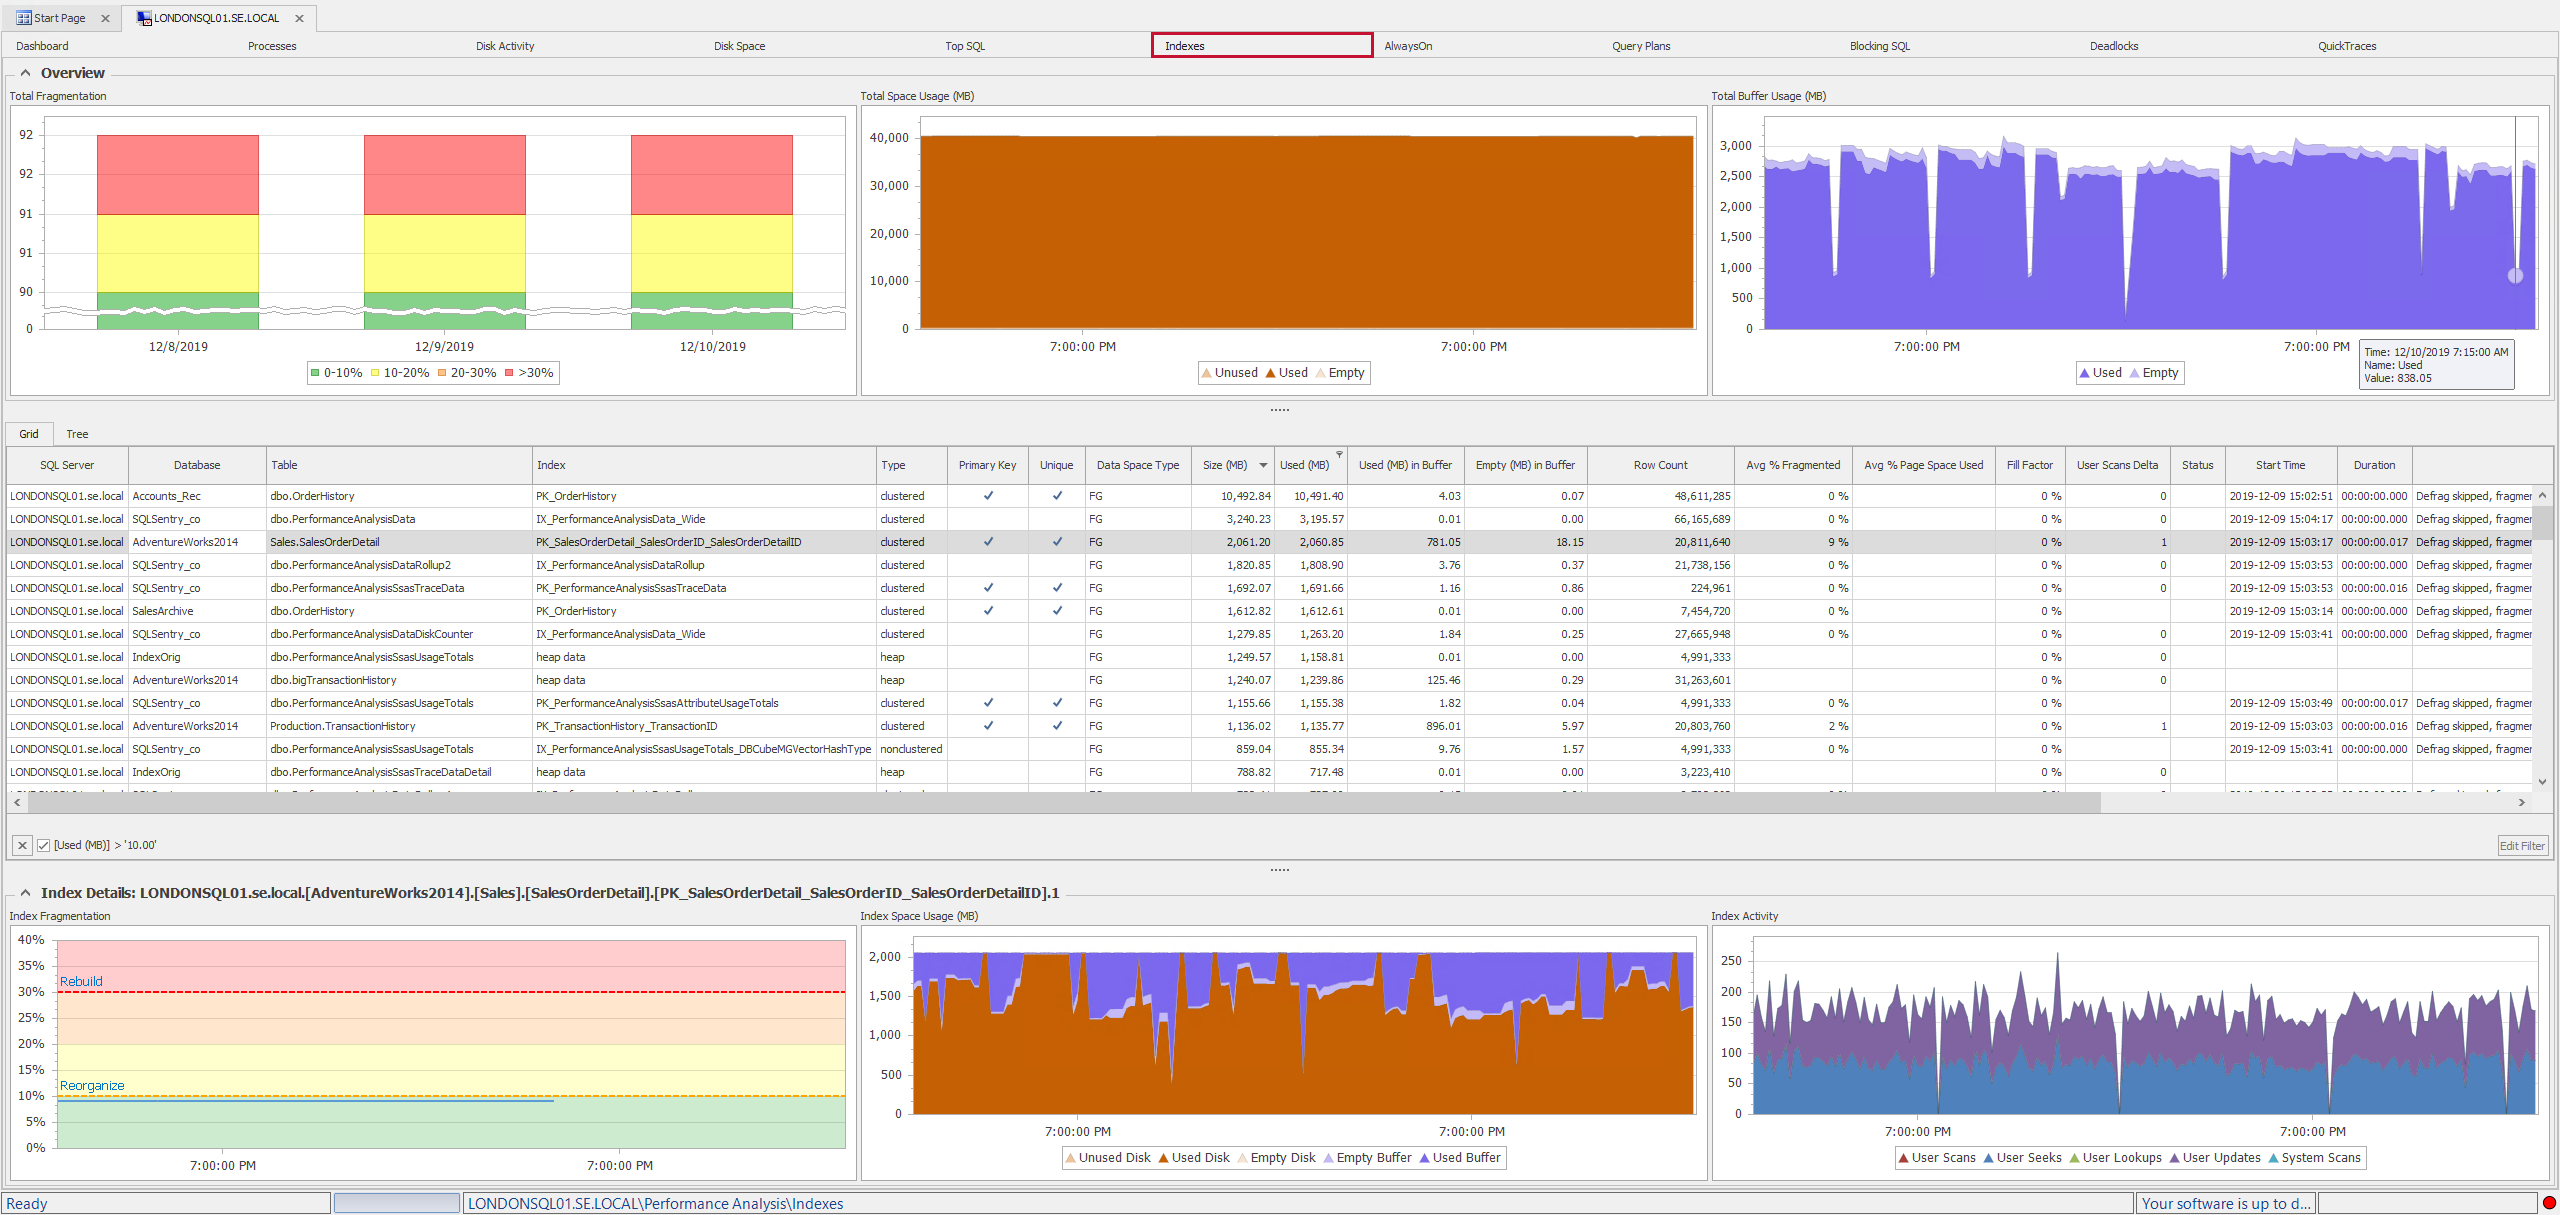
Indexes
The Indexes tab provides a view of the collected table and index information according to the settings and schedules chosen when enabling the fragmentation manager solution.

Additional Information: For more information about the Indexes tab, see the Indexes article.
AlwaysOn
The AlwaysOn tab displays information about configured availability groups.

Additional Information: For more information about the AlwaysOn tab, see the AlwaysOn article.
Blocking SQL
Blocking SQL displays a view of the blocking events that were collected on your server.

Note: Blocking SQL provides different versions of the block depending on which SPIDs were being blocked, and which SPID was the head blocker at the time.
Additional Information: For more information about the Blocking SQL tab, see the Blocking SQL article.
Query Plans
The Query Plans tab lists all plans collected for Top SQL events for the specified date range. This provides a detailed chronology of all query plan changes, so you can go back to any point in time to see when a plan change may have led to a query performance problem.

Additional Information: For more information about the Query Plans tab, see the Query Plans article.
Deadlocks
Deadlocks displays a grid of the SPIDs that owned a lock on a resource, as well as SPIDs waiting for a resource. This is a graphical representation, that allows you to easily identify the steps leading to the deadlock.

Additional Information: For more information about the Deadlocks tab, see the Deadlocks article.
Quick Traces
QuickTrace is SQL Sentry's version of profiler, but without the overhead. You can specify how long QuickTrace runs, and whether it collects statement events. Additionally, QuickTrace can be made as a response to an event.

Additional Information: For more information about the QuickTrace tab, see the QuickTrace article.
