SQL Sentry Indexes
Applies to: SQL Server, SSAS and AWS RDS targets.
Note:
-
As of version 2020.8.31, the table and index data collection is enabled by default during installation. In older versions of SQL Sentry, this feature is disabled by default.
It can be turned on by using the in-app wizard in any version.
- The defragmentation schedule must be created manually in all versions.
Indexes Tab
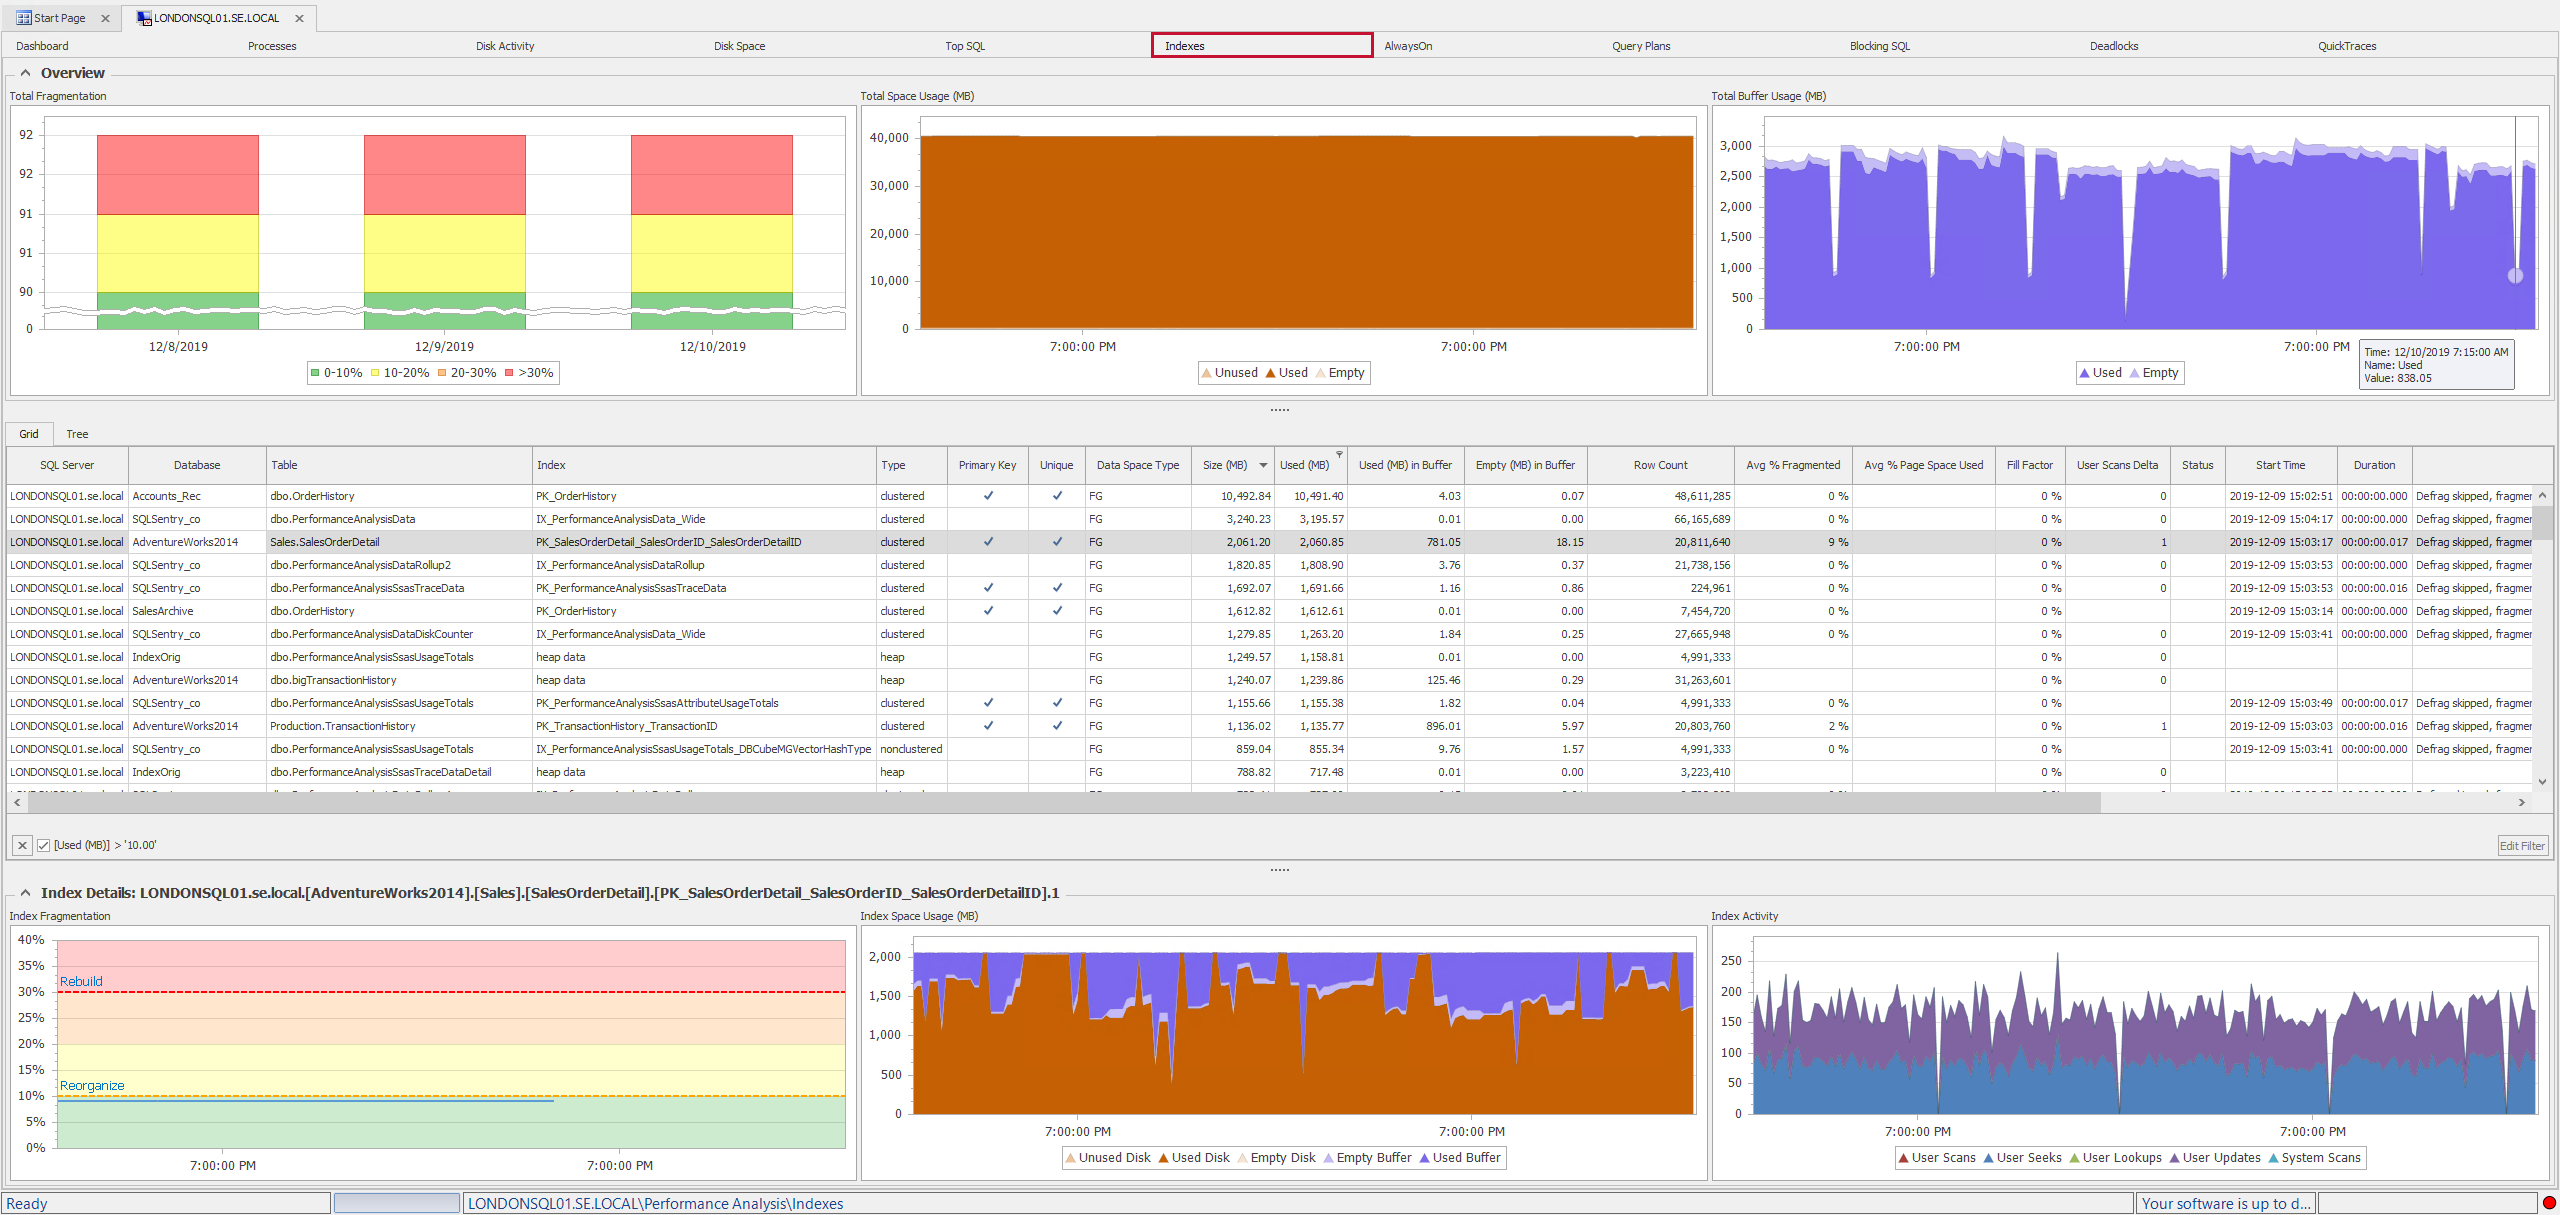
The Indexes tab displays information about your tables and indexes that are collected by SQL Sentry Fragmentation Manager. The Indexes tab helps you make intelligent decisions about index management in your environment, such as when and how to perform defragmentation operations, when to adjust fill factors, or when an index definition should be changed.

Indexes Tab Sections
| Section | Description |
|---|---|
| Overview Charts | The Overview Chart section, located at the top of the tab, displays a set of charts that contain aggregate statistics about all the indexes analyzed by Fragmentation Manager. |
| Index Grid View | The index Gridview section, located in the middle portion of the tab, allows you to view index related statistics in a tabular format. |
| Index Tree View | The index Tree view section, located in the middle portion of the tab allows you to view index related statistics in a hierarchical tree format. |
| Detail Charts | The Detail Chart section, located at the bottom of the tab, displays a set of charts that display statistics unique to the individual index. Selecting an index in the grid view area updates the detail level charts. |
| Filter |
The Filter section, located at the top of Indexes tab, is collapsed by default. It's used to filter what's shown in the Grid view section. Filter by SQL Server or database, and control the number of rows shown in the Grid view with the Show Top option. |
Note: Customize the layout of the Indexes tab, by right clicking any section heading, and then selecting the Customize Layout option.

Overview Charts
The Overview Charts contain aggregate statistics about all of the indexes analyzed on the target by Fragmentation Manager.

Total Fragmentation
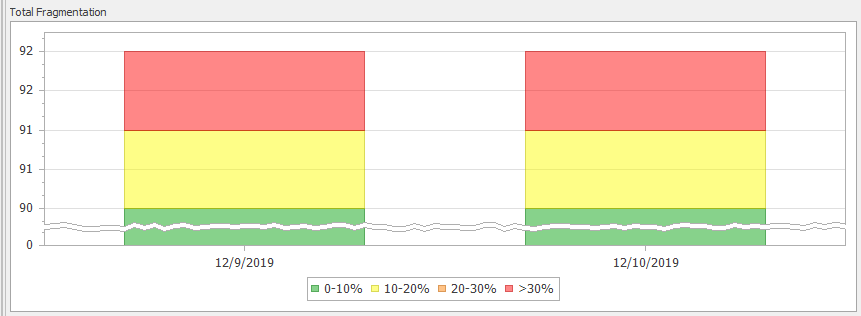
The TotalFragmentation chart displays a once a day aggregation of the fragmentation levels for all indexes that have been analyzed by Fragmentation Manager. Each index's fragmentation level for the day is summarized, and the indexes are next grouped by range; <10%, 10-20% , 20-30%, and >30%.

The Y-axis numbers represent the total number of indexes belonging to the target that have been analyzed by Fragmentation Manager. When you select a range on the chart, the indexes that fall into the corresponding range are highlighted in the index Grid view.

Total Space Usage (MB)
The Total Space Usage chart summarizes disk usage for each index that's had data collected over the specified time frame. As a reminder, adjust the minimum and maximum index size collection thresholds in the Database Source settings.
The chart has individual representations for Unused space, Used space, and Empty space. Unused space is represented at the bottom of the chart, Used space in the middle, and Empty space at the top. See the following table for explanations of each metric.
| Metric | Description | Image |
|---|---|---|
| Unused | Unused space is the amount of disk space that's been allocated for index pages, but doesn't contain any index pages. |

|
| Used | Used space is the amount of disk space that's been allocated for index pages, and does contain index pages. |

|
| Empty | This is the amount of empty or unfilled space, within any index pages. The lack of page fullness indicates that index fill factors need to be adjusted. |

|
Total Buffer Usage (MB)
The TotalBuffer Usage chart summarizes SQL Server buffer usage, during the specified time range, for each index that's had data collected. There are individual representations of Used space and Empty space.
| Metric | Description | Image |
|---|---|---|
| Used | Represents the size of the Used index pages contained within the SQL Server Buffer pool. |

|
| Empty |
Represents the amount of empty or unfilled space within those index pages that reside in the SQL Server Buffer Pool. The Empty Buffer metric can be directly mapped to the Empty Disk metric because a page that's only 50 percent full on disk is only 50 percent full when it's contained in the buffer. |

|
Detail Charts
The Detail Charts contain statistics about individual indexes analyzed on the target.

Index Fragmentation
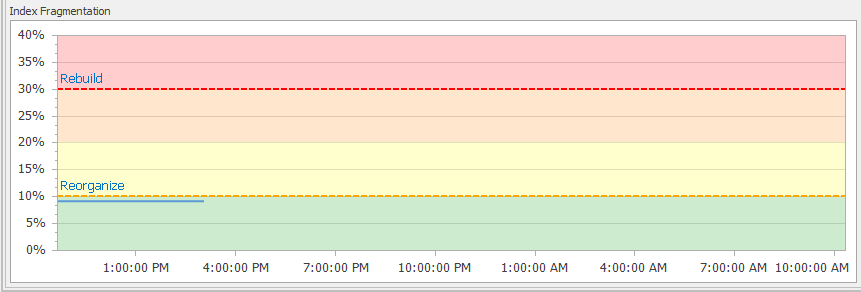
The Index Fragmentation chart shows the fragmentation percentage of the selected index, measured during each scheduled Fragmentation Scan. If a reorganization or rebuild operation is performed on the index, and the Run Post-defrag Analysis setting is enabled, data points that represent the fragmentation percent after the rebuild or reorganization operation is complete display. Use this chart to help you determine what kind of fragmentation management schedule should be applied to the index.

Each data point on the chart represents a Fragmentation Manager operation. Double-click on any data point to open the Event Calendar for the selected operation. The background colors of the chart correspond to the same ranges and colors as found in the Total Fragmentation chart.
Index Space Usage
The Index Space Usage chart shows how much of the selected index is located on the disk and in the buffer, over the selected time frame. It can also give you an idea about how much disk and buffer space is being wasted by the index due to non-full pages.
| Metric | Description | Image |
|---|---|---|
| Unused Disk | The amount of disk space that's allocated for index pages, but doesn't contain index pages. |

|
| Used Disk | The amount of disk space that's allocated for index pages, and does actually contain index pages. |

|
| Empty Disk | This is the amount of empty or unfilled space, within any of the index pages. |

|
| Empty Buffer | Represents the amount of disk space taken up by empty or unfilled space, within those index pages, that resides in the SQL Server Buffer Pool. |

|
| Used Buffer | Represents the size of the Used index pages contained within the SQL Server Buffer Pool for the specified index. |

|
Index Activity
The Index Activity chart gives you a view of how the selected index is being used over the specified time frame. Use this chart to help identify unused indexes and the cost of your heavily used indexes.
| Metric | Description | Image |
|---|---|---|
| User Scans | The number of scan operations on the index caused by user activity. |

|
| User Seeks | The number of seek operations on the index caused by user activity. |

|
| User Lookups |
The number of lookups caused by user activity.
|

|
| User Updates | The number of updates caused by user activity. Indicates the level of maintenance on the index caused by insert, update, or delete operations done to the underlying table. |

|
| System Scans | The number of scan operations on the index due to system queries. |

|
Index Grid View
The Index Grid View, located in the center of the Indexes tab, contains various statistics about your individual indexes. When you select an index in the Grid view, the Detail index charts update with information specific to that index.
Apply filters and order the data by various columns. To apply a filter to the Grid view, scroll over a column, and then select the filter symbol located in the upper right hand corner of the column header.

After you apply a filter, the filter symbol persists in the column's header, allowing you to see which columns have filters applied.

Additionally, the column name and any associated filtered text displays at the bottom of the Grid View. Use the X button located beside the filtered text to remove the filter, or use the drop-down box to cycle through filtered columns.

Edit the applied filters with the Edit Filter button found in the bottom of the Grid view. Filters can also be applied through the right-click context menu of any column.

Note: The information displayed in the Overview Charts isn't effected by filters applied in the Grid view.
To order the Grid view by a column's value, select the column header. An arrow displays in the column's header indicating that the Grid view is being ordered by that column. Cycle through ascending and descending order by selecting the column's header.

Index Grid View Columns
| Column | Description |
|---|---|
| SQL Server | The name of the SQL Server where the index resides. |
| Database | The name of the database where the index resides. |
| Table | The name of table where the index resides. |
| Index | The name of the index. |
| Type |
The type of index. Heap, Clustered index, Non-clustered index, Primary index, Spatial index, or XML index. Additional Information: For more information about the different types of indexes, see the Types of Indexes MSDN article. |
| Primary Key | Specifies if the index is part of a primary key constraint. |
| Unique | Specifies if the index is part of a unique constraint. |
| Data Space Type |
Specifies the Data Space Type:
|
| Size (MB) | The amount of disk space represented in megabytes taken up by the index. |
| Used (MB) | The amount of disk space that's allocated for index pages, and does contain index pages. |
| Used (MB) in Buffer | Represents the size of the Used Index pages contained within the SQL Server Buffer Pool. |
| Empty (MB) in Buffer | Represents the amount of empty or unfilled space, within those index pages that reside in the SQL Server Buffer Pool. |
| Row Count |
The number of rows of data belonging to the index. Note: Not available for Limited Scan mode. |
| Avg % Fragmented |
The average fragmentation percentage of the index as recorded during the last fragmentation scan. Note: Not available with a Sampled Scan for heaps. |
| Avg % Page Space Used |
The average percentage of available data storage space used in all the pages of the selected index. This indicates page fullness. Note: Not available for Limited Scan mode. |
| Fill Factor |
The Fill Factor set for the selected index. Additional Information: For more information, see the Specify Fill Factor for an Index MSDN topic. |
| User Scans Delta | The number of scan operations on the index caused by user activity since the last sample time (every 15 minutes). |
| Status | The current status of any defragmentation operations being performed on the selected index. |
| Start Time | The start time of the last defragmentation operation that was performed on the selected index. |
| End Time | The end time of the last defragmentation operation that was performed on the selected index. |
| Duration | The duration of the last defragmentation operation that was performed on the selected index. |
| Last Message | Indicates the last defragmentation operation related to this index, including the last defragmentation method used on the selected index. |
| Avg Record Size (bytes) |
Indicates the average record size in bytes for the selected index. Note: Not available for Limited Scan mode. |
| Compressed Pages | The number of compressed pages for the selected index. |
| Enabled | Indicates if the index has been made available. Set in the index properties of the native SQL Server tools. |
| Forwarded Records | Represents the number of records in a heap that have forward pointers to another data location. Forward pointers can be added during updates, when there isn't enough room to store the new row in the original location. Note: Only available for Index Type: Heap. Not available with a Limited Scan. |
| Ghost Records |
Number of ghost records ready for removal by the ghost cleanup task in the allocation unit. Ghost records are records that have been logically deleted from a page but not physically deleted. Additional Information: For more information about Ghost Records, see the following two SQL Skills articles: Note: Not available with a Limited Scan. |
| Pages | The total number of index pages for the selected index. |
| Unused Disk (MB) | The amount of disk space that's allocated for index pages, but doesn't contain index pages. |
| Used % | The percent of disk space that's allocated for index pages and contains index pages. |
| Version Ghost Records |
Number of ghost records retained by an outstanding snapshot isolation transaction in an allocation unit. Note: Not available with a Limited Scan. |
| LOB Data | Specifies if the index contains one or more LOB data type. |
Index Grid View Context Menu Commands
The following commands are available through the right-click context menu of the Index Grid and Tree View:
| Command | Description |
|---|---|
| Index Properties | Views the Index Properties of the selected index in the native SQL Server tools. |
| Analyze Fragmentation Now |
Selected your desired mode to perform a fragmentation analysis on the selected item.
Additional Information: For more information about Scan Modes, see the sys.dm_db_index_physical_stats (Transact-SQL) MSDN article. |
| Defragment Now |
Use the Rebuild (offline), Rebuild (online), or Reorganize command to immediately perform the selected operation. Additional Information: For more information about reorganizing and rebuilding indexes, see the Reorganizing and Rebuilding Indexes MSDN article. Indexes that contain LOB columns cannot be Rebuilt online. When the Defragment Now > Rebuild (online) command is used on indexes that contain LOB columns an offline rebuild is performed. |
| Exclude Index from Automated Defrag or Analysis | The Exclude Index from Automated Defrag or Analysis excludes the selected index from future Fragmentation Manager operations. After an index has been excluded it displays with a gray background in the data grid. |
| Reset Fragmentation Stats | The Reset Fragmentation Stats command resets statistics for the selected item, including the Avg percentage Fragmented statistic. |
| Jump To |
Jump To Navigator opens the selected item in the Navigator pane. Jump To Calendar opens the Calendar for the last analysis or defragmentation event start time. |
| Copy | Copies the selected row or cell. |
